WRITING
Three Down Days, Three Lower Strikes: A Week of Laddering Covered Notes

QQQ fell three days in a row, and I bought 400 more shares — but every hundred was immediately locked into a "note," each rung with a lower strike than the last.
In the previous post I took the note's pricing apart: a 21.6% headline yield with only ~3% mathematical expectation, the gap being the price of the cushion. This week is not about models — it's the live trading. Over three days QQQ slid from 682 to 661, and I bought 400 shares in four tranches, selling one in-the-money call against each hundred to lock it into a note: strike 630, then 610, then 600.
The conclusions first:
| My question | What this week answered |
|---|---|
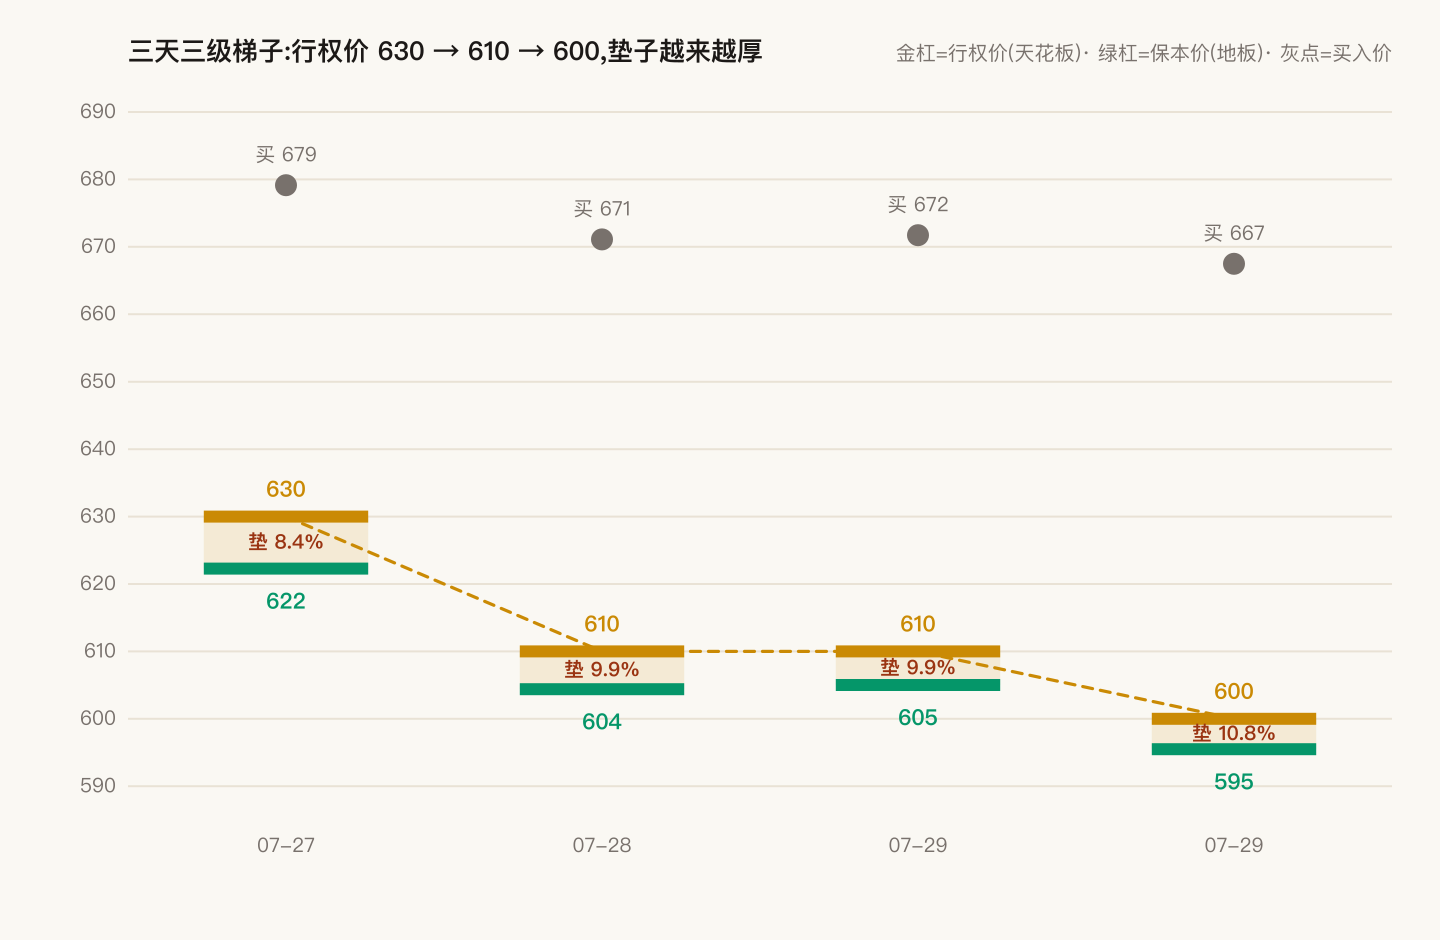
| How do you open notes in a selloff? | Move the strike down with the tape. Three rungs in three days: 630 → 610 → 600, and the cushion (room below breakeven) widened from 8.4% to 10.8% |
| Who pays for the thicker cushion? | The coupon. Real income per share (time value) fell from 7.72 to 4.51, gross annualized from 18% to 12% — the more fear, the more ceiling you trade for floor |
| What about the old short calls that decayed into worthlessness? | Close them all, rebuild at same/next-day expiry near the money. Daily rent per contract jumped from ~0.25 to ~4.6; the account now collects $3,254 of time value per day |
| Did it make money? | Coupons kept arriving: 8 notes outstanding, net coupon $19,161. Net value kept falling: −3.06% on 07-29, and cumulatively it's losing too — since 07-09 (first benchmarked record) −8.93% vs QQQ −8.51%, the excess return flipped negative only yesterday. Both ledgers are true |
0. Three days, three rungs
Three main tickets (plus one same-terms add-on on 07-29), all with the same shape: buy 100 shares of QQQ, sell one call expiring 08-21 with a strike below the current price. The only difference is how low the strike goes:
| Opened | Buy price | Strike (vs spot) | Call premium | Breakeven | Cushion | Real income/share | Gross annualized |
|---|---|---|---|---|---|---|---|
| 07-27 | 679.15 | 630 (−7.2%) | 56.87 | 622.28 | 8.4% | 7.72 | 18.1% |
| 07-28 | 671.12 | 610 (−9.1%) | 66.71 | 604.41 | 9.9% | 5.59 | 14.1% |
| 07-29 | 671.73 | 610 (−9.2%) | 66.71 | 605.02 | 9.9% | 4.98 | 13.1% |
| 07-29 | 667.49 | 600 (−10.1%) | 72.00 | 595.49 | 10.8% | 4.51 | 12.0% |
How to read it: the strike is the ceiling — if QQQ doesn't fall below it at expiry, the shares are called away at that price and my profit is the coupon; the breakeven is the floor — only below it do I start losing. The space between ceiling and floor is the cushion.
1. Who pays for each lower strike
The premium you collect is not all profit. Take the 07-29 ticket: the 600 call sold for 72.00, but 67.49 of that is intrinsic value — with QQQ at 667.49, the contract already embeds the 667.49 − 600 delivery gap, effectively prepayment for selling the stock at 600. What I actually earned is the remaining 4.51, what traders call time value.
So the price of a rung is never the headline premium; it's the "rent" you agree to accept. Line the week's four rungs up:
- Real income thins rung by rung: 7.72 → 5.59 → 4.98 → 4.51
- The cushion thickens rung by rung: 8.4% → 9.9% → 9.9% → 10.8%
- The ceiling lowers rung by rung: 630 → 610 → 610 → 600
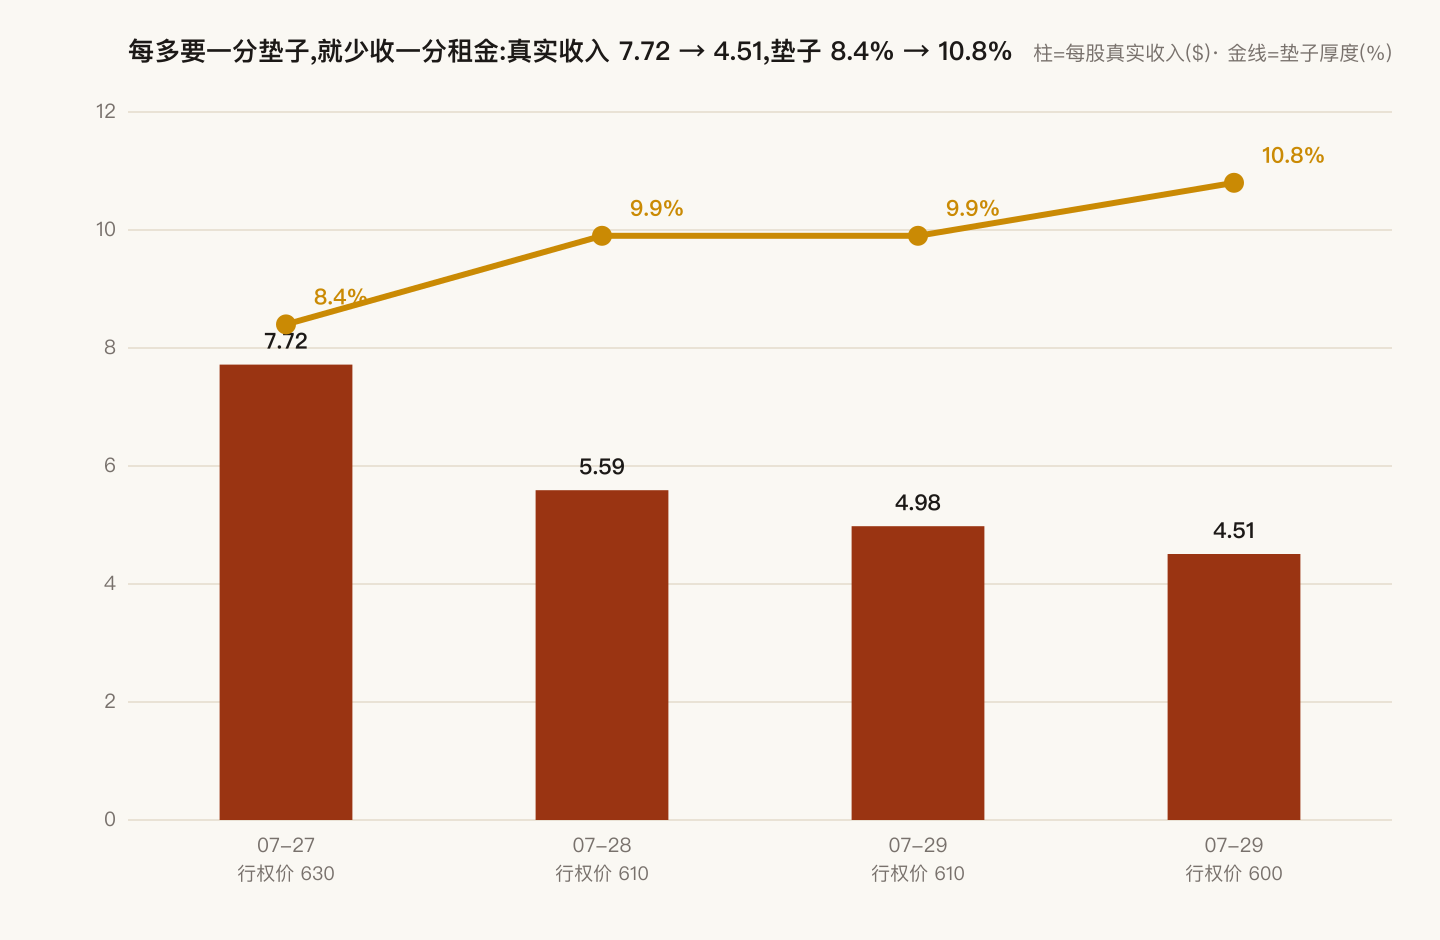
Why accept lower strikes in a selloff? Two reasons. First, insurance gets expensive in a falling market — the same 10 points lower locks away more cash. Second, after three down days, my confidence in "back above 680 within a month" is honestly smaller than my confidence in "not below 600." Last post said the cushion is never free — this week's ladder is what paying that sentence looks like, ticket by ticket.
2. Moving the rent collection up close
The week's other half dealt with the old inventory. I was carrying a batch of August calls with strikes from 705 to 725, opened higher up. After the slide, those strikes were hopelessly far away — each contract earned maybe 0.25 a day, pointless to keep.
Over two days I closed all of them and rebuilt at same-day or next-day expiry, strikes 664 to 676, right against the spot price. The effect was immediate: rent per contract per day jumped from ~0.25 to ~4.6 — eighteen times. These rolls collected a net $12,878 on 07-28 and another $6,088 on 07-29. The whole account's short calls together now collect $3,254 of time value per day.
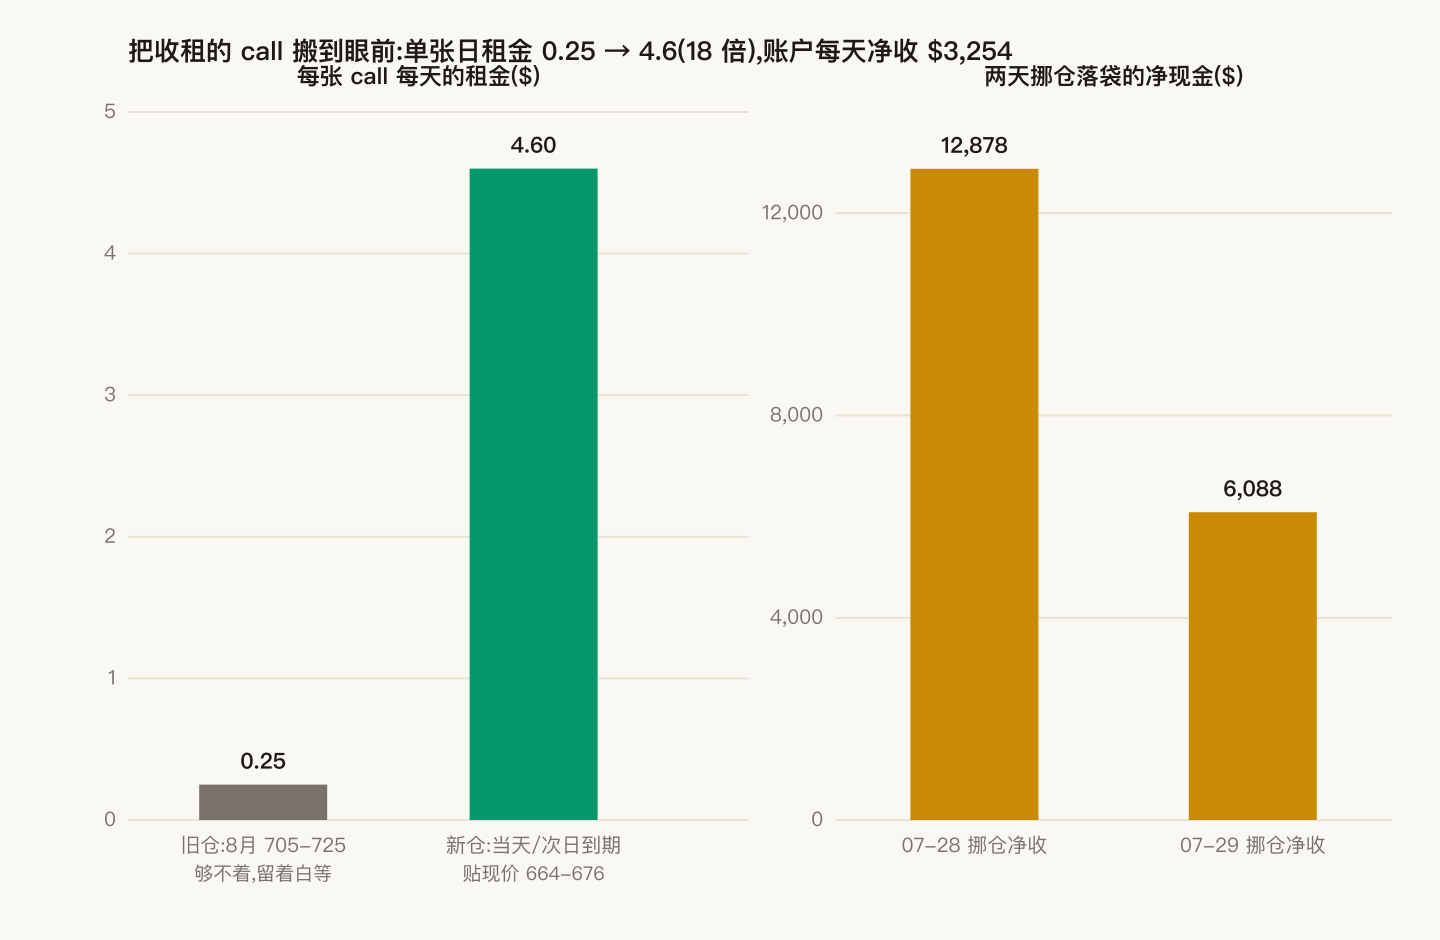
The cost, in writing: with strikes hugging the spot price, a single up day closing above 675/676 turns those 15 calls into delivery obligations, and I'm rolling again at the open. This rent is not free — it wholesales the first few points of any rally, one day at a time. The next big green day will convert these tickets, one by one, into money I didn't make.
3. Two ledgers: coupons arrive, net value falls
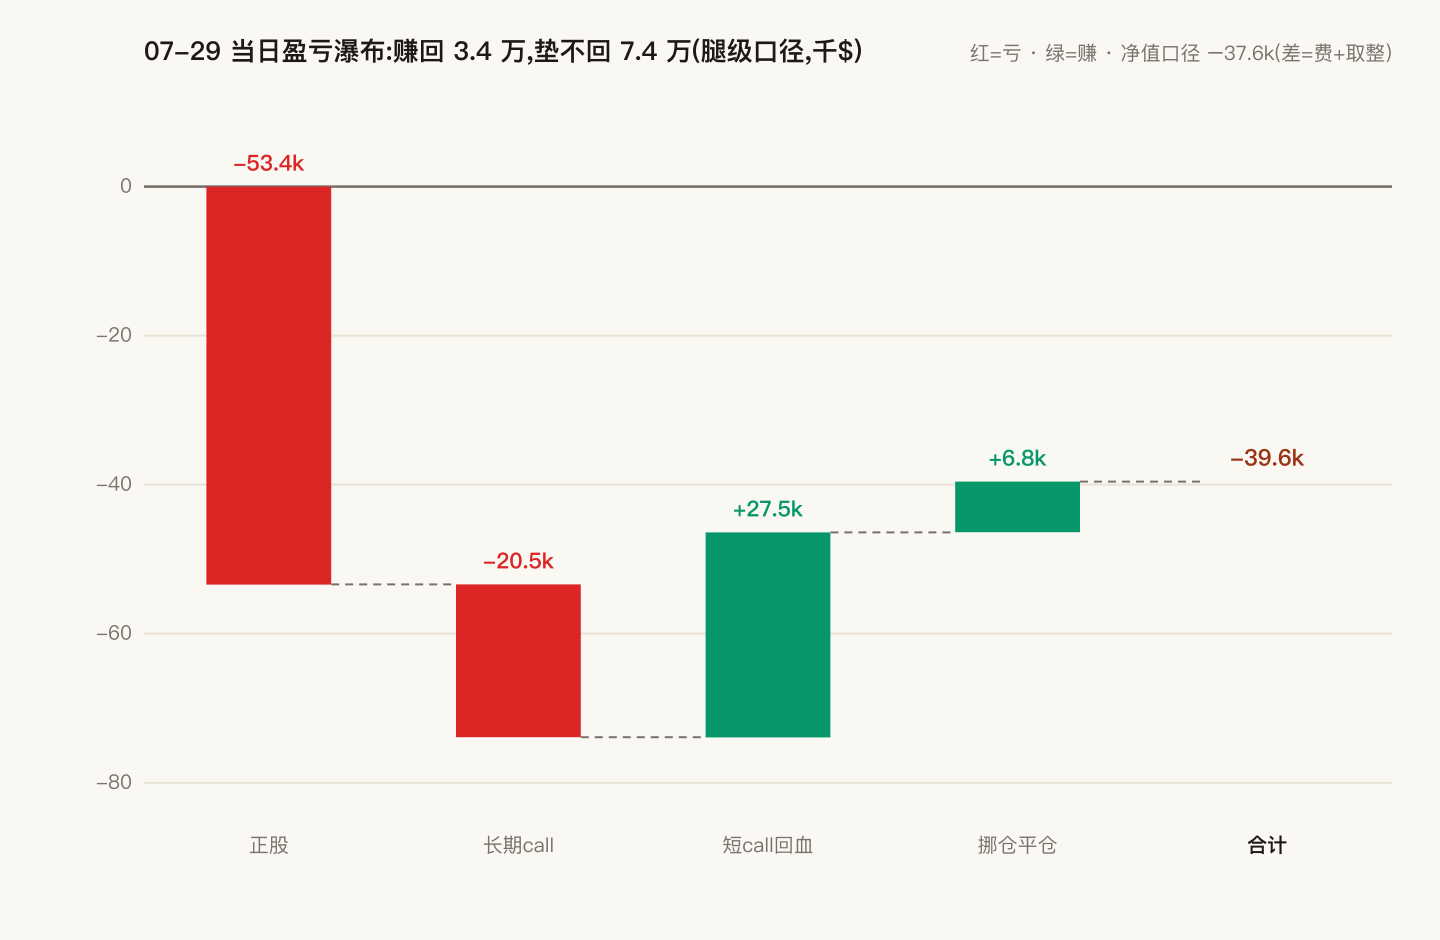
Finally, the 07-29 account laid flat — the most honest physical this structure gets. Net value fell $37,623 (−3.06%), a full point worse than QQQ (−2.04%). Where it was lost and where it was earned, line by line:
| Item | Daily P&L |
|---|---|
| Shares (3,700 QQQ + INTC/NFLX/GOOG) | −53,360 |
| 18 long-dated calls (leveraged downside) | −20,547 |
| 74 short calls (earning it back in the selloff) | +27,451 |
| Rolls closed during the day | +6,783 |
| Total (leg-level) | −39,673 |
The other ledger belongs to the notes themselves: 8 outstanding, coupons totaling $24,210, minus $5,049 of margin interest, net $19,161 collected; on $1,324,790 of principal, a 16.1% net annualized rate. That ledger is winning, and by last post's 25-year replay it probably keeps winning.
But honesty requires holding both at once. The coupon is "the speed of the winning periods"; net value is "the margin after claims." In a selloff, rent arrives and net value falls — both true at the same time. What actually keeps me up isn't the −3.06%. It's that margin debt has reached $1.57M and my safety buffer sits below the 40% floor I set for myself — adding shares into a selloff means betting the initiative on "it won't fall much further." The ladder is still being built downward, and the price of every rung is recorded here.
4. The honest audit: cumulatively, I'm now behind QQQ
This last chapter is for myself, and it has to be written. Losing a point in one day can be argued away; the cumulative curve doesn't argue. Since 07-09, the first day with benchmark records, the account (deposit-adjusted) is −8.93% versus QQQ's −8.51% — 0.42 points behind, and the deficit only appeared yesterday.
Split the three weeks apart and the story gets sharper:
- 07-09 to 07-21: the lead kept widening to +1.66pp — the cushion was genuinely working, bleeding slower than QQQ
- 07-21 to 07-28: the lead narrowed to +0.55pp — Intel dropped 10.7% in two days, and the long-dated calls amplified QQQ's slide
- 07-29 alone: −1.02pp of excess in a single day — three weeks of accumulated outperformance surrendered at once, flipped to −0.42pp
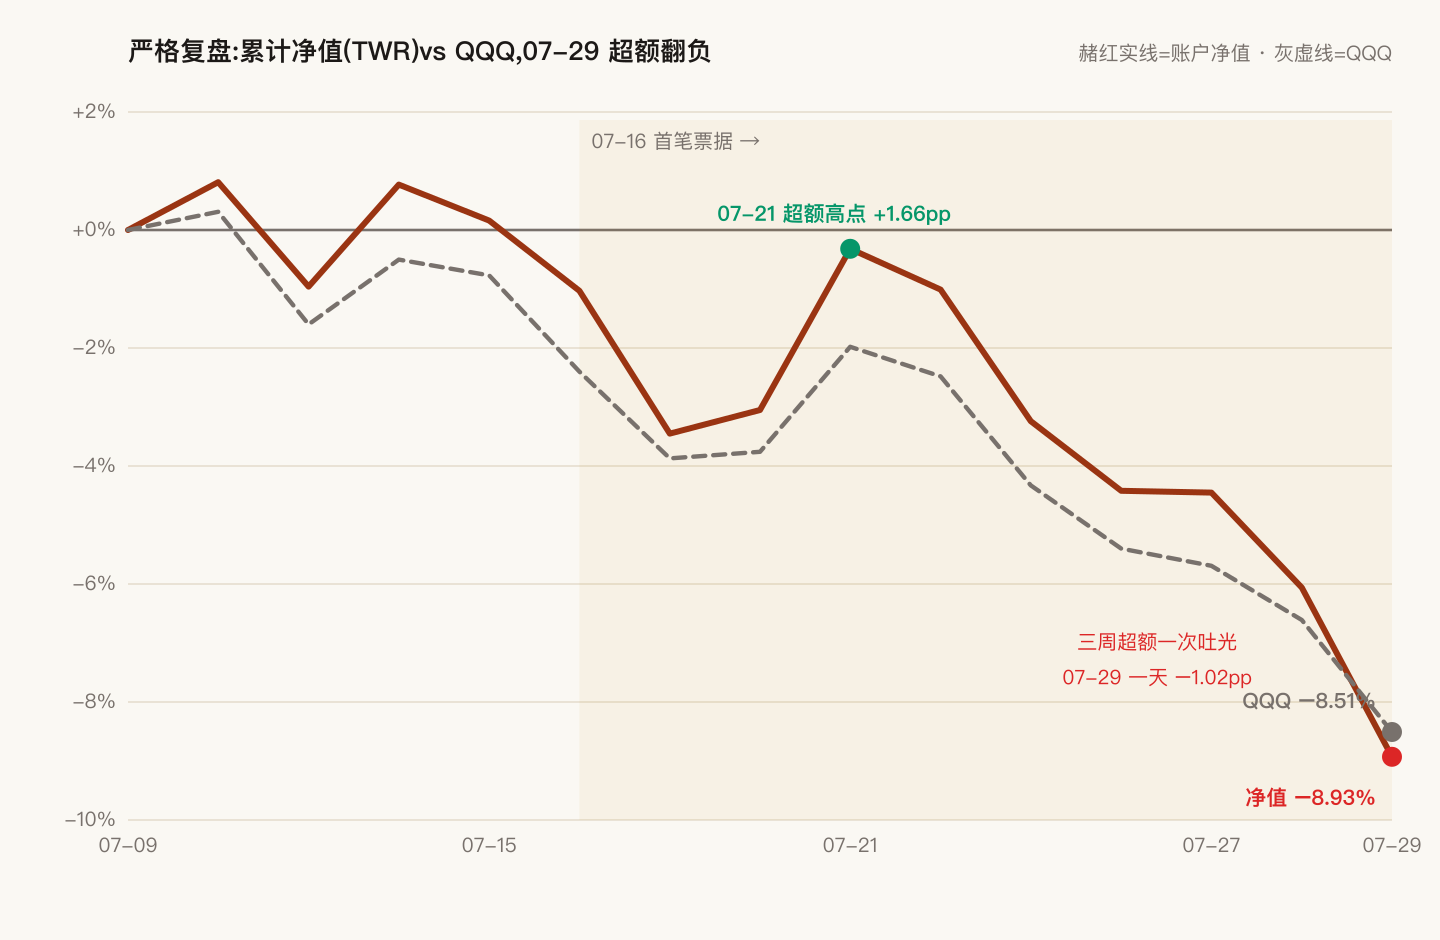
Where was it lost? Not in the note half — the 8 notes' net $19,161 coupon is real. It was lost in the uncovered directional exposure: 3,700 shares plus 18 long-dated calls, a net directional book twice the account's net value. The 74 short calls collect $3,254 of rent a day; the directional book can lose $74,000 in the same day. The strategy earns small money; the position loses big money — close the two ledgers together and you get exactly this 0.42-point deficit.
Last post I wrote that "don't cover the whole position" was the antidote. This week proved I truly didn't cover it all — but my directional exposure is larger than the covered part, so the cushion got demoted from insurance to comfort blanket. This is the most expensive record of the week — more expensive than the $37,623.