WRITING
The Index Jumped 1.85%, I Rose 2.82%: The Formula I Published Yesterday Got Audited Today

July 21, 2026, Tuesday. The index closed at 708.97, up 1.85% — the biggest single-day move since this series began, and this time it pointed up.
In yesterday's post, section two, I wrote the P&L of my 49 short calls out as a straight line, and added one sentence: this leg is structurally incapable of making money in a big rally.
Today the market came to grade the homework. I did nothing all day: zero fills.
1. The rally-day decomposition: the cushion goes back to being a brake
The result first: net value +2.82%, index +1.85%, ahead by 0.97 points.
One day after its first shift as the main engine, the cushion returned to its usual job — braking.
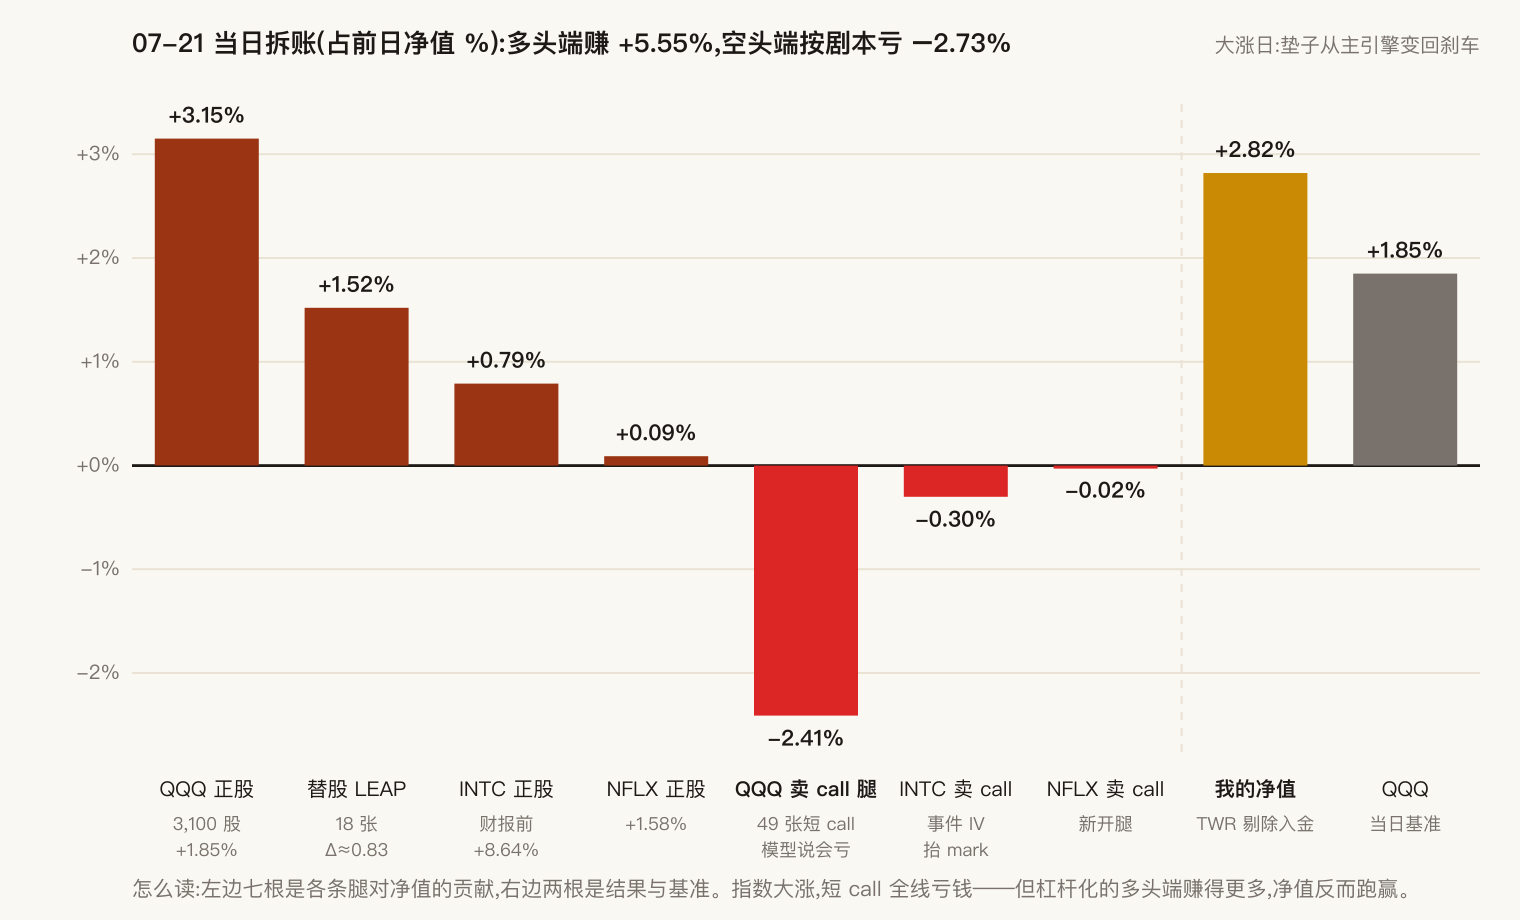
There's an apparent contradiction in that table: yesterday I argued the call-selling leg can't make money in a rally; today came a big rally, and the whole book beat the index handily. Why?
Because that argument was about one leg, not the book. My net directional exposure at Monday's close was 1.31 times net value — the long side, shares plus LEAPs, eats a rally at an amplified ratio (+5.55%). The short-call leg lost money exactly on script (−2.41%), but it lost less than the long side gained. Leverage decided that today was a win; the short calls only decided how much of the win got taxed away.
2. The formula gets graded: predicted −2.28%, actual −2.41%
Take yesterday's equation and swap the theta term from a three-day window to a single day:
short-call leg (single day, % of net value) = +0.125 − 1.297 × index move (%)
Substitute today's +1.855%: 0.125 − 1.297 × 1.855 = −2.28%.
Measured: the 49 short calls lost −2.41% on the day.
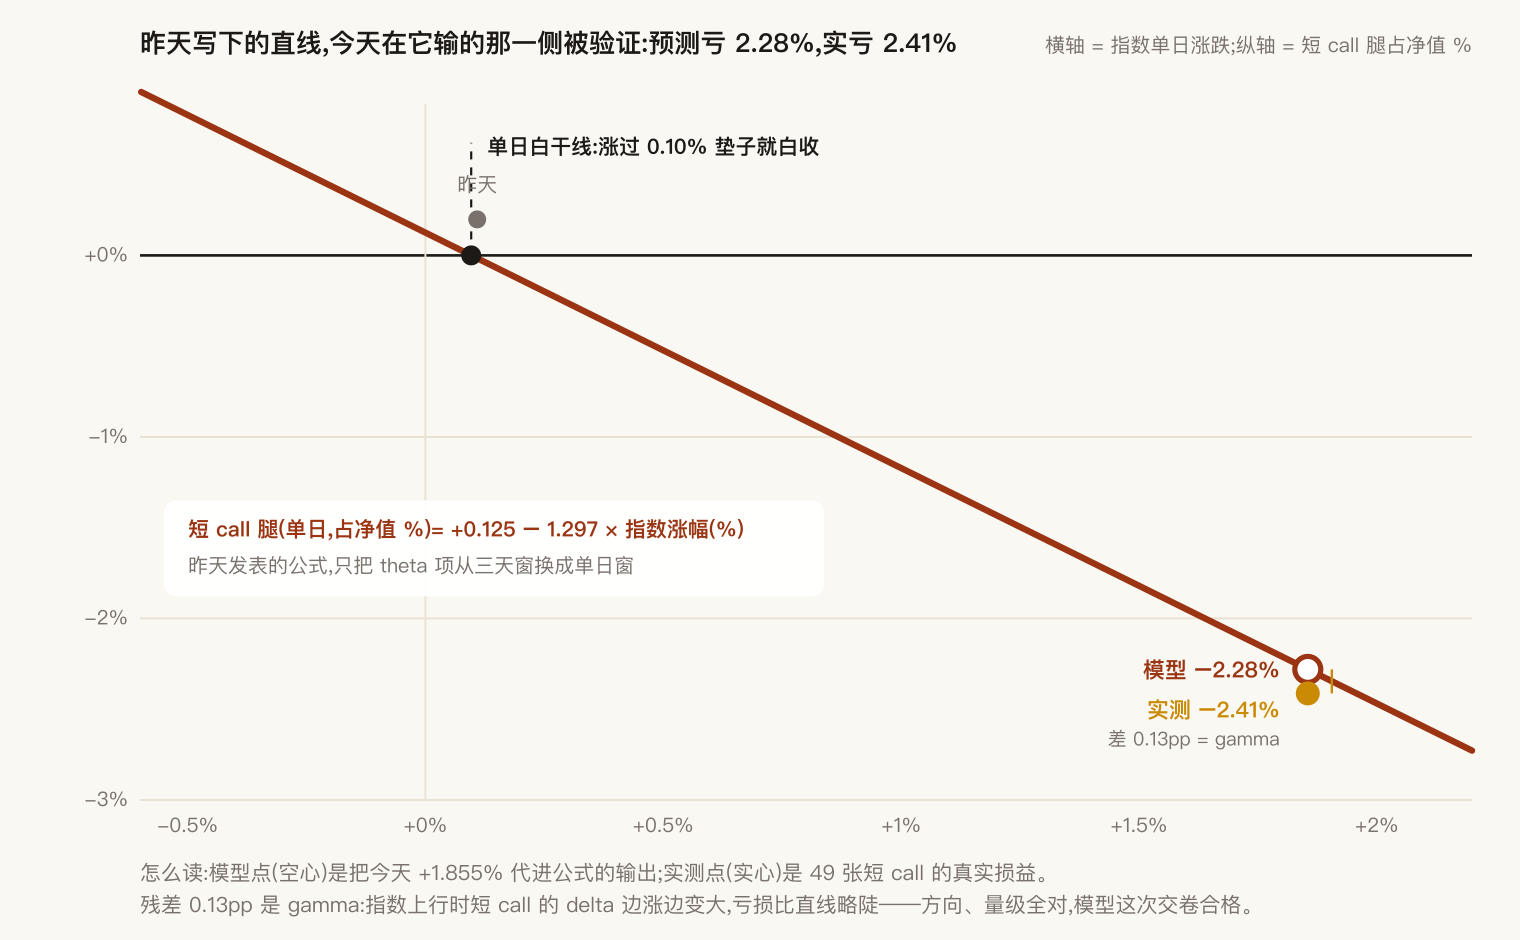
That 0.13-point gap is exactly the gamma the line doesn't model, as flagged yesterday: when the index rallies, a short call's directional exposure isn't constant — it grows as the move grows, so the real loss runs slightly steeper than the line. Yesterday's flat-tape residual was 0.035 points; today's rally residual is 0.13. The residual growing with the move is itself what gamma predicts. Right direction, right magnitude, right error shape — the model passes.
For scale: the single-day "worked-for-nothing line" sits at just 0.096% — any daily rally past that, and the time value is fully eaten by the directional loss. Today's move was 1.855%, nineteen times past that line. This leg didn't work for nothing today; it stood deep on the losing side and lost precisely what it had promised to lose.
3. The other face of negative gamma: the net long melts away
Last week, in the selloff, I wrote: when the index falls, the short calls' deltas melt and the net long exposure rises on its own — the cushion thickens as you fall. Today that mechanism showed its other face.
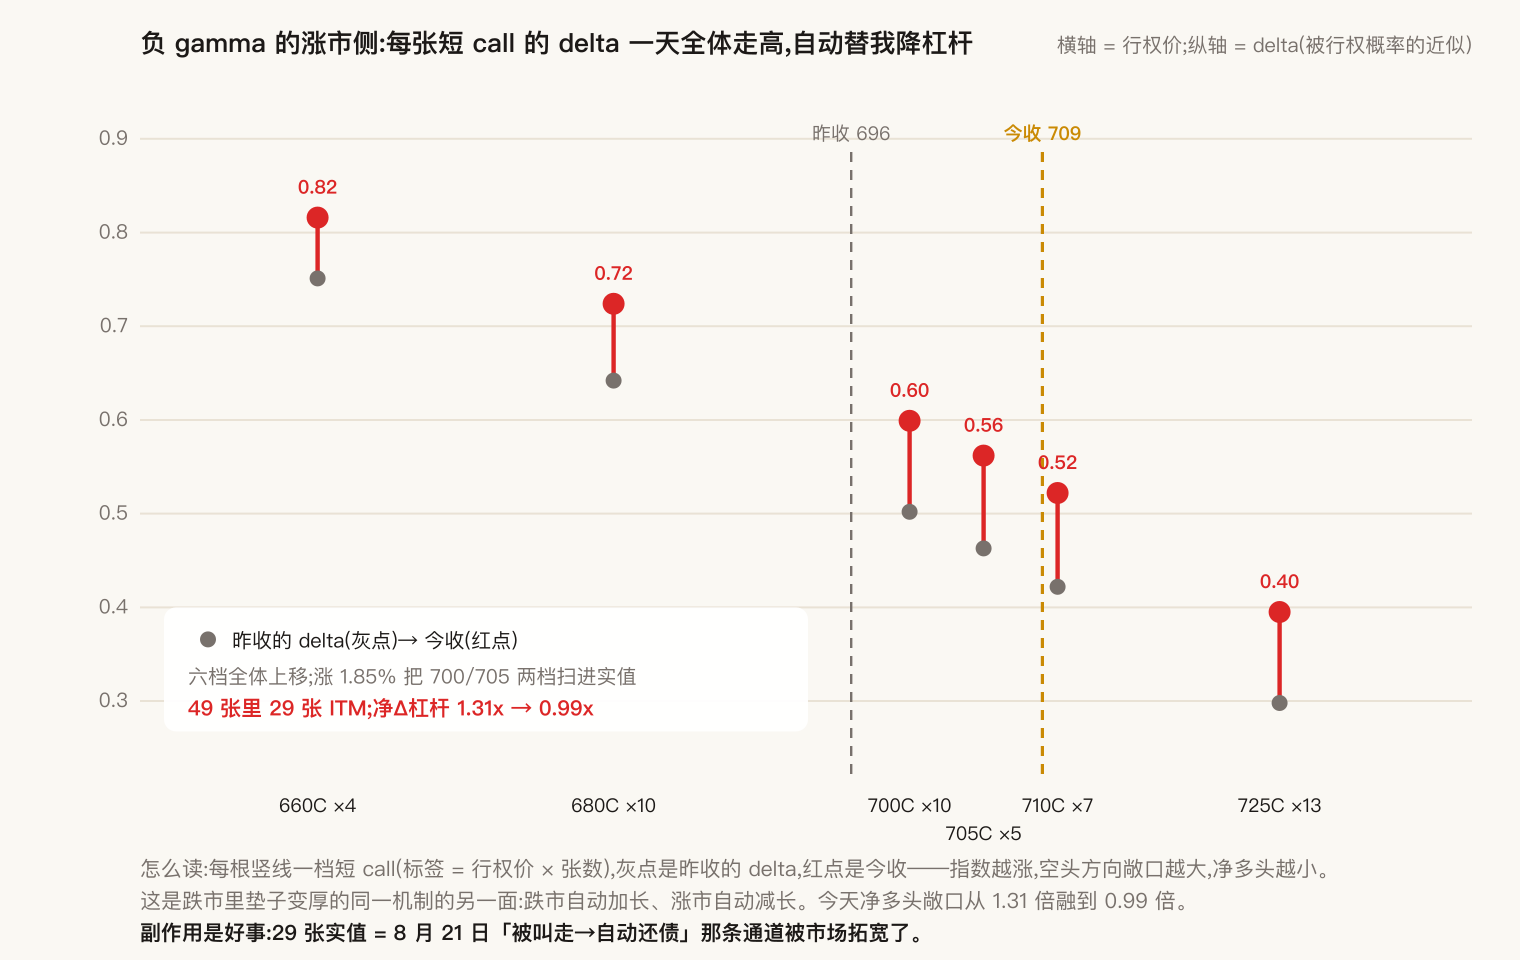
The index rises, every short call's delta climbs, the short-side exposure grows — net long exposure melted from 1.31× at Monday's close to 0.99× in a single day. Today I still ate the rally at an amplified ratio; if it rallies again tomorrow, I'll eat less than one-for-one. The more it rises, the less of each next rise I participate in. That is the precise meaning of selling your upside for rent — and today, for the first time, it got measured in the up direction.
But the same fact has a good side: 29 contracts in the money means the August 21 "called away → debt auto-repays" channel just got widened by the market. The two chip-stock 90-calls are now deep in the money (delta 0.80) — assignment next Friday is close to a certainty; and on the 1,100 shares I was assigned last week, the 70-call's probability of expiring worthless fell from about seventy percent yesterday to about 63%, with the called-away probability jumping from 29% to 37% in one day — on a stock that itself rose just 1.58%. Probabilities aren't labels glued to a trade. They move every day.
4. A deposit five days late, and three flags that healed in one day
The **1.19M to $1.11M.
So the three ugliest numbers on yesterday's report all flipped at once:
| Metric | 07-20 | 07-21 | Note |
|---|---|---|---|
| Gross leverage | 2.65x | 2.49x | Back under my own 2.5x hard cap |
| Distance to a margin call | 32.2% | 38.5% | Still below my 40% floor, but 6.3 points repaired in a day |
| Financing cost | 4.00%/yr | 3.38%/yr | Back below the risk-free benchmark (~3.6% Treasuries) |
The third line means yesterday's alarm — "the stable end of the barbell has started yielding to the cost of its own financing" — stood down today. The safe leg's carry is positive again.
But honesty requires the next sentence: none of the three flags was healed by me. The numerator was a deposit; the denominator was a +2.82% day the market handed over. My trade count today was zero. When the tape is good, the risk report flatters itself — which is exactly when it lies best. The same table gives it all back on one 2% red day. So the discipline doesn't stand down just because we're at 2.49x: expiry proceeds repay debt first, and no new money enters the note pipeline until gross leverage holds steady. The market deleveraged me today. That is not the same as being allowed to outsource risk control to the market.
5. Scoreboard
| Session | My portfolio | Index | Excess |
|---|---|---|---|
| Fri 07-10 | +0.81% | +0.31% | +0.50pp |
| Mon 07-13 | −1.76% | −1.90% | +0.15pp |
| Tue 07-14 | +1.74% | +1.12% | +0.63pp |
| Wed 07-15 | −0.60% | −0.27% | −0.33pp |
| Thu 07-16 | −1.19% | −1.64% | +0.46pp |
| Fri 07-17 | −2.44% | −1.51% | −0.93pp |
| Mon 07-20 | +0.41% | +0.11% | +0.30pp |
| Tue 07-21 | +2.82% | +1.85% | +0.97pp |
| 8-day cumulative | −0.31% | −1.98% | +1.66pp |
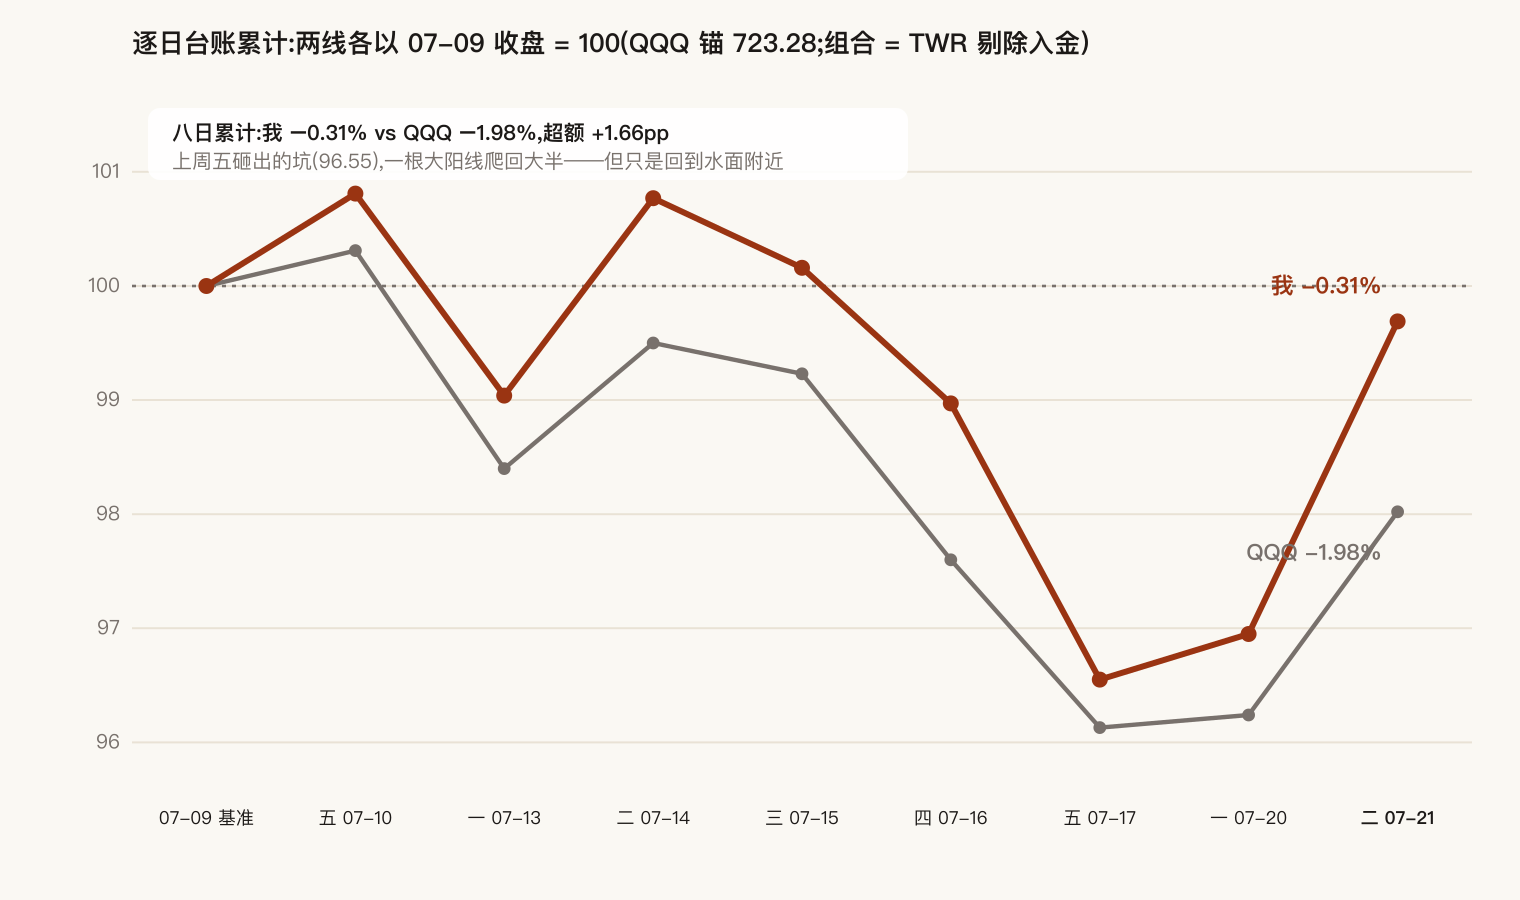
Conventions in full: the portfolio is TWR (deposits excluded — today's $86,000 is stripped out), anchored to 07-09's close = 100; the excess column subtracts the two daily returns. Over eight days I lead by 1.66 points, of which 0.97 came from today alone — and the day the lead widened most was precisely the day the short calls lost the most. Both things being true at once is this structure's entire character.
Close
Three things worth keeping on paper today:
The model was validated on its losing side. Predicted −2.28%, actual −2.41%. A formula that only holds on days that flatter it is marketing; a formula that prices its own losses correctly is a tool.
Good days deleverage you and repair your risk report — and neither can be trusted. The net long melting from 1.31× to 0.99× was the structure acting on its own; the three flags healing was the tape plus one deposit. I did nothing today, and everything improved. Improvement that contains no decisions offers nothing to rely on.
The caps have started to bite. 29 of 49 contracts in the money — the upside is being welded shut, layer by layer. This book is turning from an offense book into a debt-repayment book, and the market widened the August 21 valve by a full turn today.
The first exam is the chip stock's: earnings Thursday, July 23; ten 110-calls expiring Friday; in between, an event priced at 182% implied volatility. How event pricing settles its bill is the next post.