WRITING
Sold-Off Volatility Is the Seller's Harvest

When the market falls, exactly one thing gets more expensive: fear itself. And an options seller is someone who sells fear.
At 10:33 this morning I did two things in nineteen seconds: bought 100 shares of QQQ, then immediately sold away every dollar of upside above 630.
From the outside that looks like disarming yourself the moment you pick up the weapon. It's actually the most standard move in this playbook: build the note into the selloff. One sentence of logic — when the market drops, implied volatility rises, and rising implied volatility means the thing I'm selling just went up in price.
1. The scoreboard first
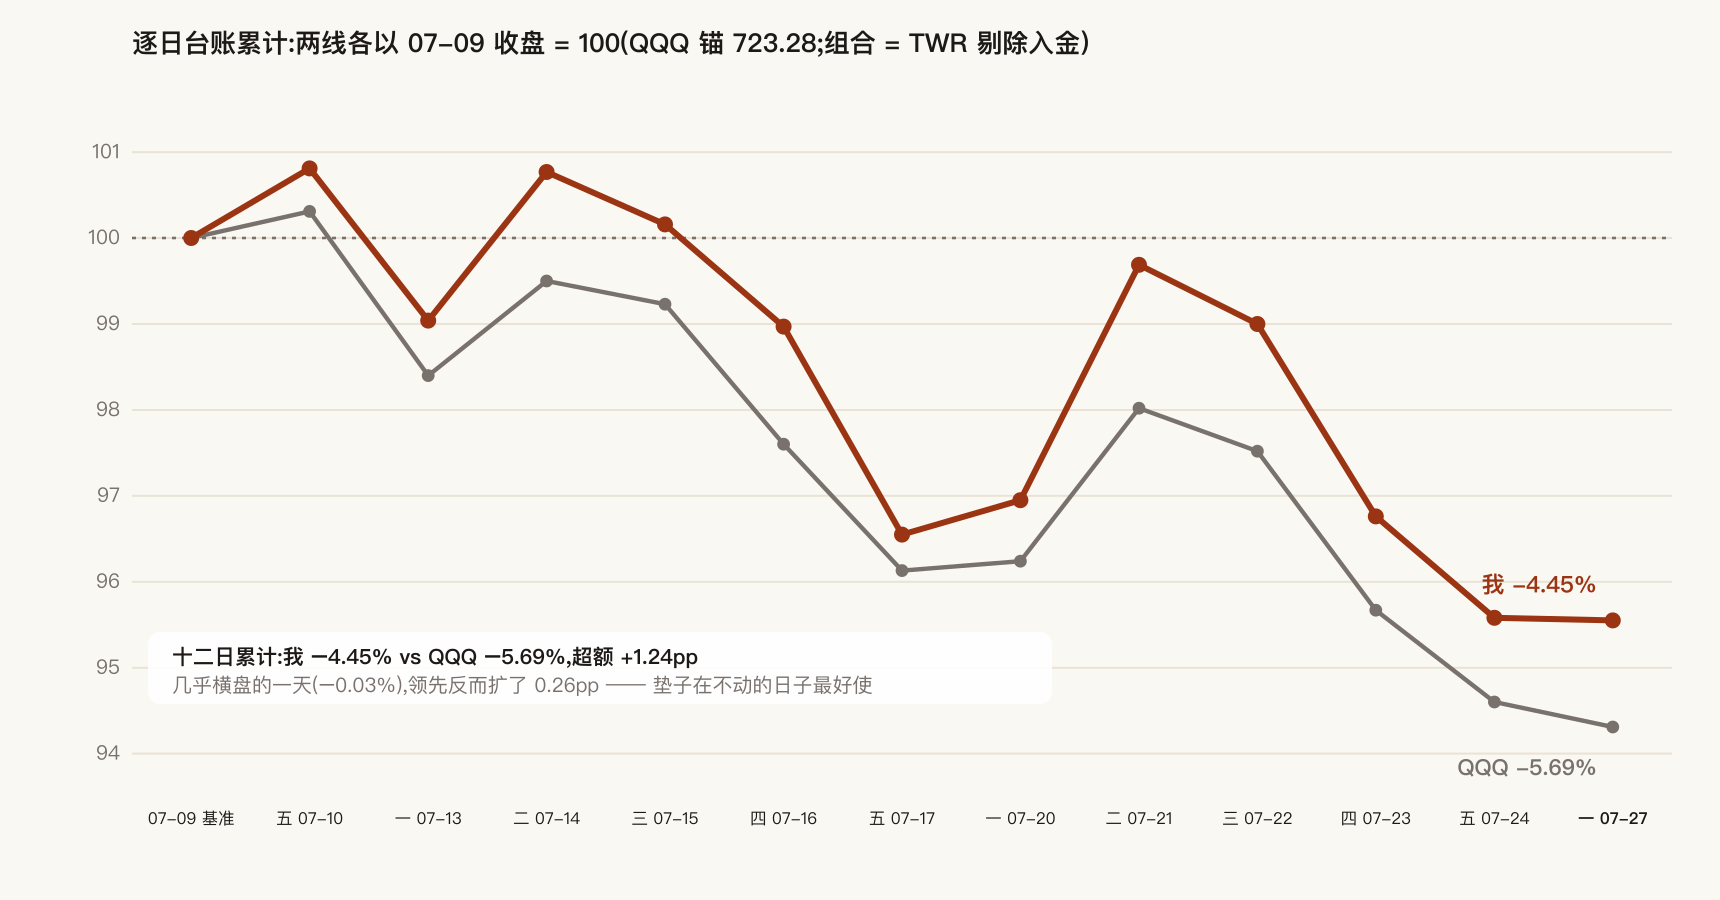
Today was close to flat: me −0.03%, QQQ −0.31%, ahead by 0.28pp. Twelve sessions in: −4.45% against QQQ's −5.69%, with the lead widening to 1.24pp.
Worth pausing on one thing: the lead widened on a day when nothing moved.
The mechanism is simple. The pile of calls I've sold drips time value into my pocket daily. When the market drops hard, they fall faster than the stock and the cushion is thickest. When it rips higher, they rise faster and the cushion becomes a ceiling. Only on days when the market doesn't move is that time value pure profit — no directional move to offset it.
So flat tape is the friendliest weather this book gets. Today the internals rotated (the Dow rose 0.51% as falling oil lifted cyclicals; the Nasdaq slipped 0.18% under Nvidia's weight), the index went nowhere, and I quietly collected a day's rent.
2. Why you build notes into a selloff
This is the engine of the whole approach, so let me be precise about it.
What an options seller collects is priced by one variable: implied volatility — the market's expectation of how violently things will move. Calm market, low IV, you collect less for the same contract. Frightened market, high IV, the identical contract sells for far more.
And IV moves inversely to price. When the index gets hit, buyers of protection multiply and sellers thin out, so IV rises across the board. Which means: the decline itself is marking up the seller's inventory.
So on my book, a drop isn't a question about whether to buy the dip. It's a question about what price insurance has reached. QQQ has been grinding down from its July 9 high and IV has been climbing the whole way. Today's trade was placed inside that markup window.
This is not the same thing as "it fell, so buy." Buying the dip is a bet on direction. Selling insurance into the dip is a bet on other people's fear of direction — you don't need to be right about which way it goes, only that the fear was priced above what actually gets delivered.
3. Why 630 and not 650 or 680
This is the real craft of the day.
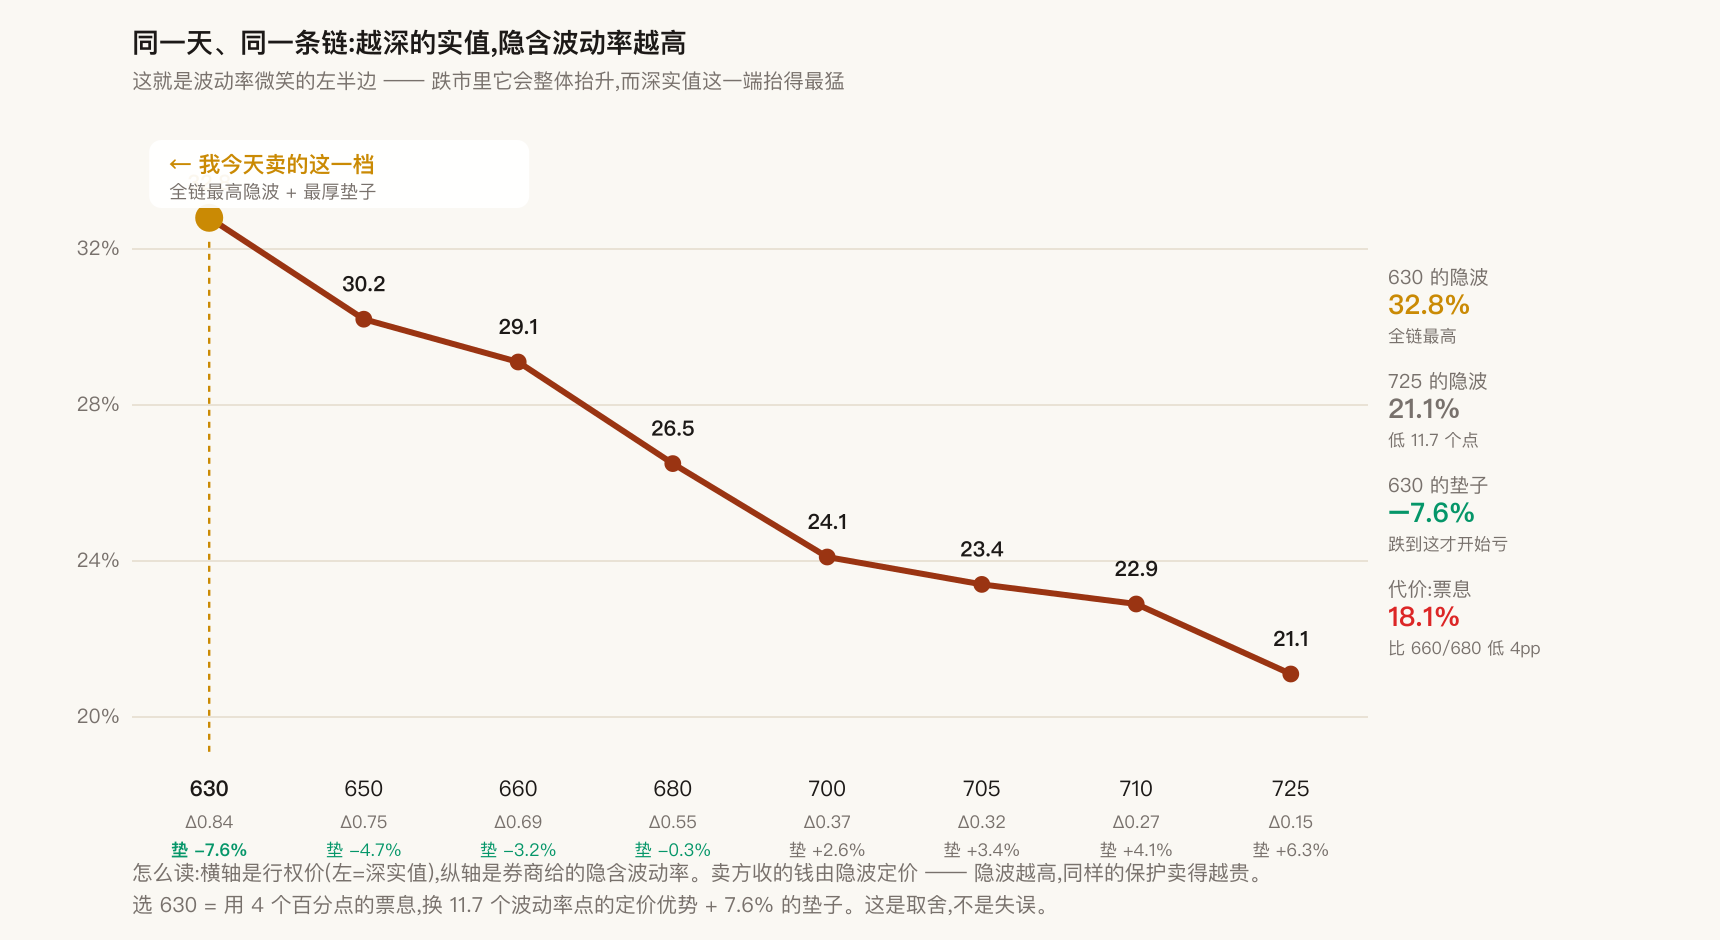
On the same day, same expiry, same chain, IV isn't one number — it's a slope:
- The 630 strike I sold prints 32.8% — the highest on the chain
- The furthest strike, 725, prints just 21.1%
- A spread of 11.7 volatility points
That slope is the volatility smile (its left half, properly), and it reflects a permanent fact: the market always prices downside more expensively than upside. In a selloff the whole slope lifts, and the deep in-the-money end lifts hardest.
Which makes "which strike" a question with an actual answer:
| Choosing 630 | Choosing 680 (the max-coupon strike) |
|---|---|
| IV 32.8%, the richest on the chain | IV 26.5% |
| Cushion −7.6%, no loss until 630 | Cushion −0.3%, essentially none |
| Coupon 15.5% annualized | Coupon 41.1% annualized |
I gave up 25.6 percentage points of coupon for an 11.7-vol-point pricing edge plus a 7.6% cushion.
A correction to my first version, which said four points. That 4 came from subtracting two different formulas: 18.1% was this trade's capped profit over its net cost; 22.1% came from a different table entirely — annual time-decay over stock market value. Different denominators, not subtractable. Recomputed on one formula (capped profit ÷ net cost × 365/25, both at the close), 630 is 15.5% and 680 is 41.1% — I gave up 25.6 points, not 4, off by more than six times.
The trade itself didn't change, but its character is now clear: this isn't "collect slightly less in exchange for a cushion." It's paying away two-thirds of the coupon to buy that cushion. Whether that's worth it is a separate question — but you have to read the price tag correctly first.
It still isn't conservatism. It's picking the best value point on the same chain. Chasing the highest coupon means standing where there is no cushion — which in a falling market is a bet on the bounce, exactly the bet I don't want to make.
And one denominator flips the answer. If the question isn't "how much coupon" but "how much margin capacity does this consume," the 630 wins: $11,180 consumed at a 110.2% return, against $14,980 at 100.6% for the 680. One trade, three denominators, three answers — which is exactly why you have to say which one you mean.
4. How much risk did this actually add
Here's the number that flips the whole reading if you skip it.
- Buy 100 shares: exposure +100 shares
- Sell 1× 630 call (delta 0.841): exposure −84.1 shares
- Net exposure: 15.9 shares
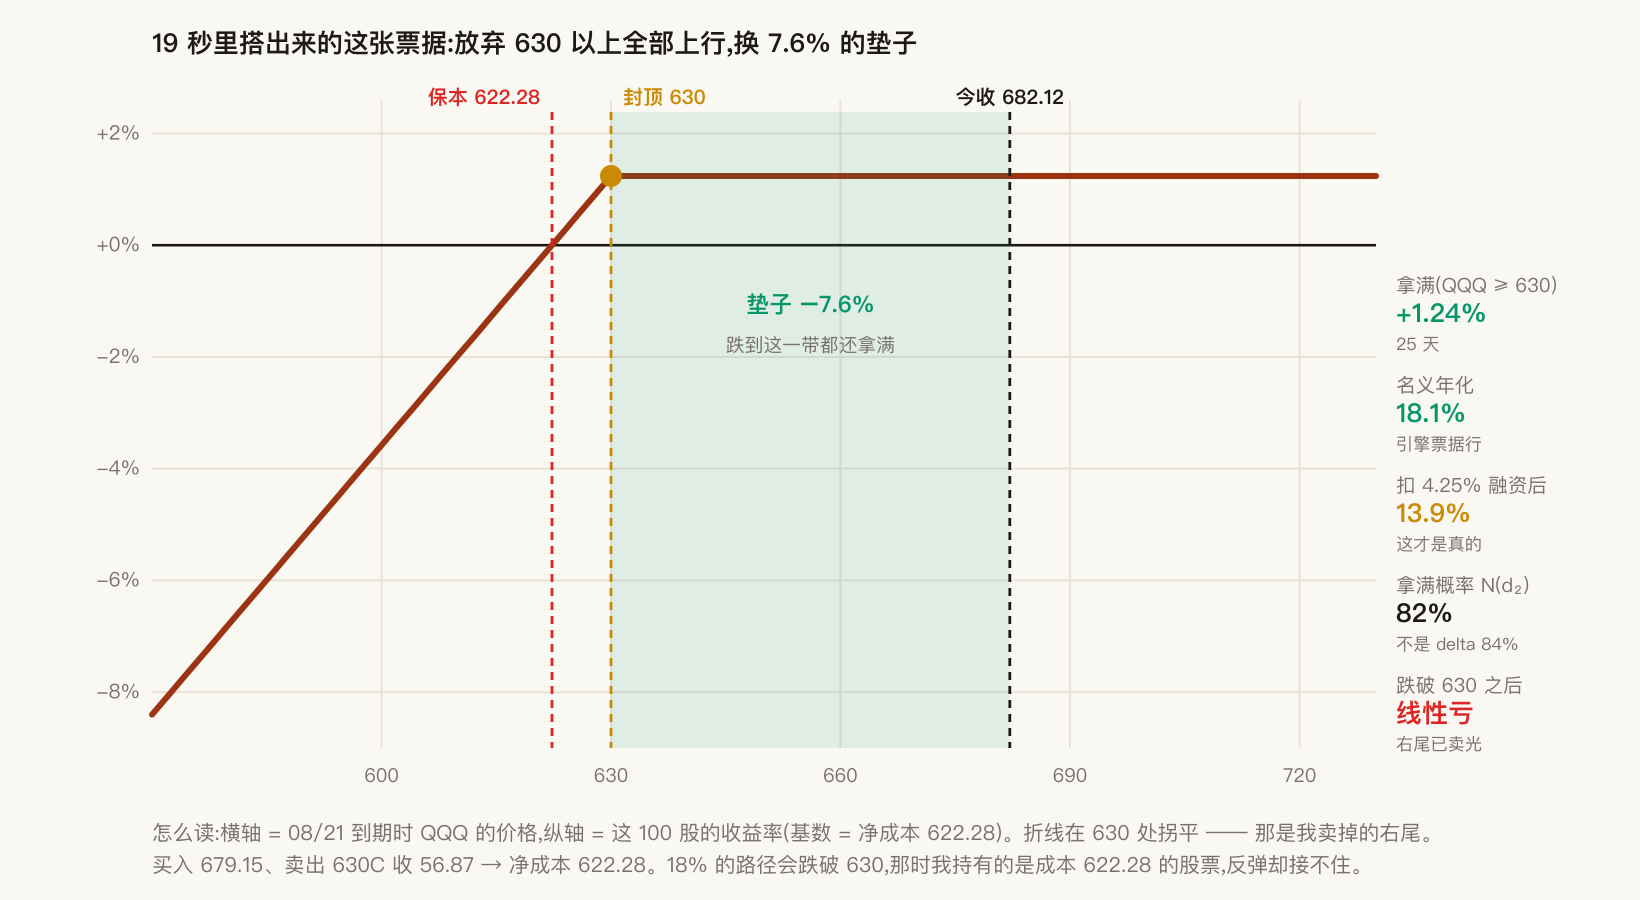
The financing consumed is for 100 shares. The market risk actually carried is 15.9 shares. Eighty-four percent was hedged away within nineteen seconds.
That's also the truth behind today's change in net exposure on this book. The ratio did tick up — but this trade accounts for only 12% of that move; the other 88% came from short options shrinking as the market fell, which happens to me, not because of me. Blend those two sources together and you'll misread a hedged position as added leverage.
One trap I did walk into today — twice over.
My own risk script computed the margin cushion at 26.2%, which looks alarming. The broker's screen says 39.85%. The natural first read: I'd just hedged away 84% of the exposure, so the broker must be crediting that hedge and my script must not be.
Then I reimplemented the broker's calculation line by line. Both of those judgments were wrong.
The two numbers are the same dollars over two different denominators. The broker's is (portfolio value − total maintenance requirement) ÷ portfolio value. Mine divides that same cushion by the collateral value of the stock, which answers a different question: how far can the stock fall. Recomputed on the broker's formula with the same day's numbers, my own engine returns 39.96% — 0.11 points from the broker's 39.85%, and that gap is just closing marks versus the moment I took the screenshot. The formula was right all along. The error was comparing two denominators and then announcing I was standing under the floor.
And reimplementing it turned up something more useful, which is the opposite of my guess: the broker's margin engine doesn't look at delta at all. It multiplies each position by a ratio — stock 25%, options 100%. That 100% on options means the call I sold lowers my portfolio value and lowers the maintenance requirement by exactly the same amount. They cancel. In the margin ledger a short call neither consumes my cushion nor protects it.
So the hedge reduces economic risk, not margin consumption. Today's trade costs, precisely: 0.75 × $67,915 (the collateral the stock contributes) − $62,228 (net cash out) = about $11,300 of cushion. That's the entry that belongs in the book.
5. Two ledgers I have to state myself
One: delta is not a probability.
Collecting in full requires QQQ to sit at or above 630 at expiry. The screen shows delta 0.841 and plenty of people read that straight across as 84% odds — wrong. Delta is a hedge ratio; the actual probability of finishing in the money is a different quantity, and solving it with today's IV and time remaining gives 82%.
Two points sounds trivial, but the direction is fixed: delta always overstates your odds of collecting. Use it as a win rate out of habit and every trade you place is quietly flattering itself.
Two: financing comes out before you report the return.
These shares were bought on margin. At the broker's 4.25%, 25 days of carry costs 1.81 per share. Net it out and 18.1% nominal becomes 13.9% real.
Still a good trade — 13.9% beats a 4.25% cost of funds and the carry is genuinely positive. But if you ever catch me saying "this one annualizes at 18%," that's me skipping the financing. Don't believe it.
6. Alphabet: up 2.34%, I kept 18%
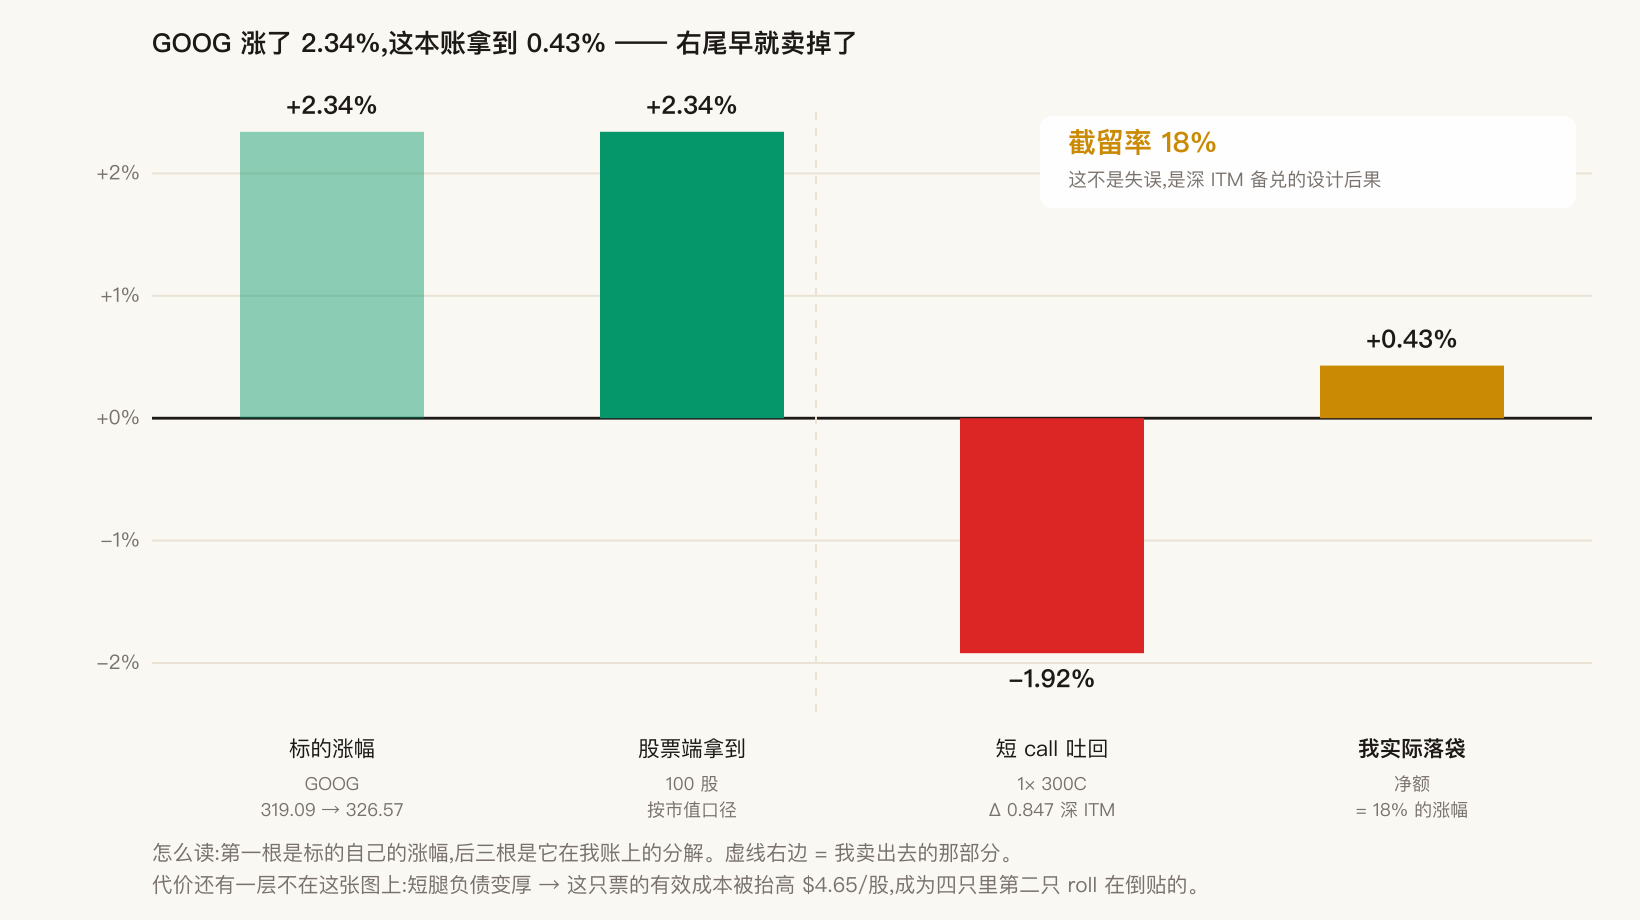
Alphabet rose 2.34% today — after last Wednesday's capex panic knocked it down 6–7%, several brokerages reiterated their bullish calls and the market re-read that 82% cloud growth figure.
I kept 0.43%. Capture rate: 18%.
Not a mistake — a contract term. That call is struck deep in the money (delta 0.847), which is another way of saying those shares are already sold at a fixed price and simply haven't been delivered. Not participating in the rally is the design working.
I write it down because this square is worth remembering: the same structure is a cushion on the way down and a ceiling on the way up. Those are two faces of one coin, and accepting one means forfeiting the right to complain about the other. By deliberately building another identical note on QQQ today, I've accepted that when QQQ rallies back next month, I'm capped at 630 there too.
The one genuinely new cost to book: that option's liability got heavier, pushing Alphabet's effective cost basis up 4.65 per share. It's now the second of my four holdings where rolling makes the basis worse rather than better (the other is Netflix). Rolling is supposed to lower your cost; on a rising stock it runs backward.
7. Two positions need handling Thursday
What I left alone today, I was right to leave alone: the Intel options have 25 days left and made money on their own today; the Alphabet call is design working as intended. No triggers met — acting would just pay friction.
The forced decisions expire Thursday, July 31: the Netflix calls and a slice of the Intel ones. Both sit almost exactly at their strikes (deltas 0.568 and 0.592), so assignment is close to a coin flip.
These two are different animals. Intel getting assigned is cashing out a winner — that program has rolled for over two months and the premium collected long ago pushed its effective basis below zero. Netflix getting assigned is taking a 3% loss; the strike is below my cost, so premium there is loss mitigation, not rent. Same word, "assigned" — one is a payday, one is a stop. Don't describe them with the same vocabulary.
8. What the day leaves behind
One: a decline is the seller's harvest season. IV moves inversely to price, so volatility sold off into existence is premium marked up. When you see a big drop, ask what insurance now costs — not whether to buy the dip.
Two: on a single chain, picking a strike is pricing coupon against cushion. The deep in-the-money end carries the highest IV, the thickest cushion, and the lowest coupon. Today I gave up 25.6 points of coupon for 11.7 vol points plus a 7.6% cushion, and I'd make that trade again — but only with the price tag read correctly: it costs far more than I first thought.
Three: when two numbers disagree, check the denominator before you doubt the formula. Net exposure of 15.9 shares and a nominal 100 shares really are different things; 26.2% and 39.85% are not — they're one cushion read two ways. The explanation I first reached for, "the crude measure can't see my hedges," was fluent, flattering, and wrong. Fluent explanations are the dangerous ones, because they don't make you go copy out the other side's formula. Copying it out is what revealed that the broker never looks at delta — the hedge cuts economic risk, not margin consumption.
Nineteen seconds is fast. But fast isn't careless — a trade-off you've already thought through doesn't need thinking through twice.