WRITING
Below the Line I Drew Myself: 83% Was the Market, 17% Was Me
A line getting crossed, and a line getting crossed by you, are two completely different things. It took me half an hour today to separate them. The answer was 83 to 17.
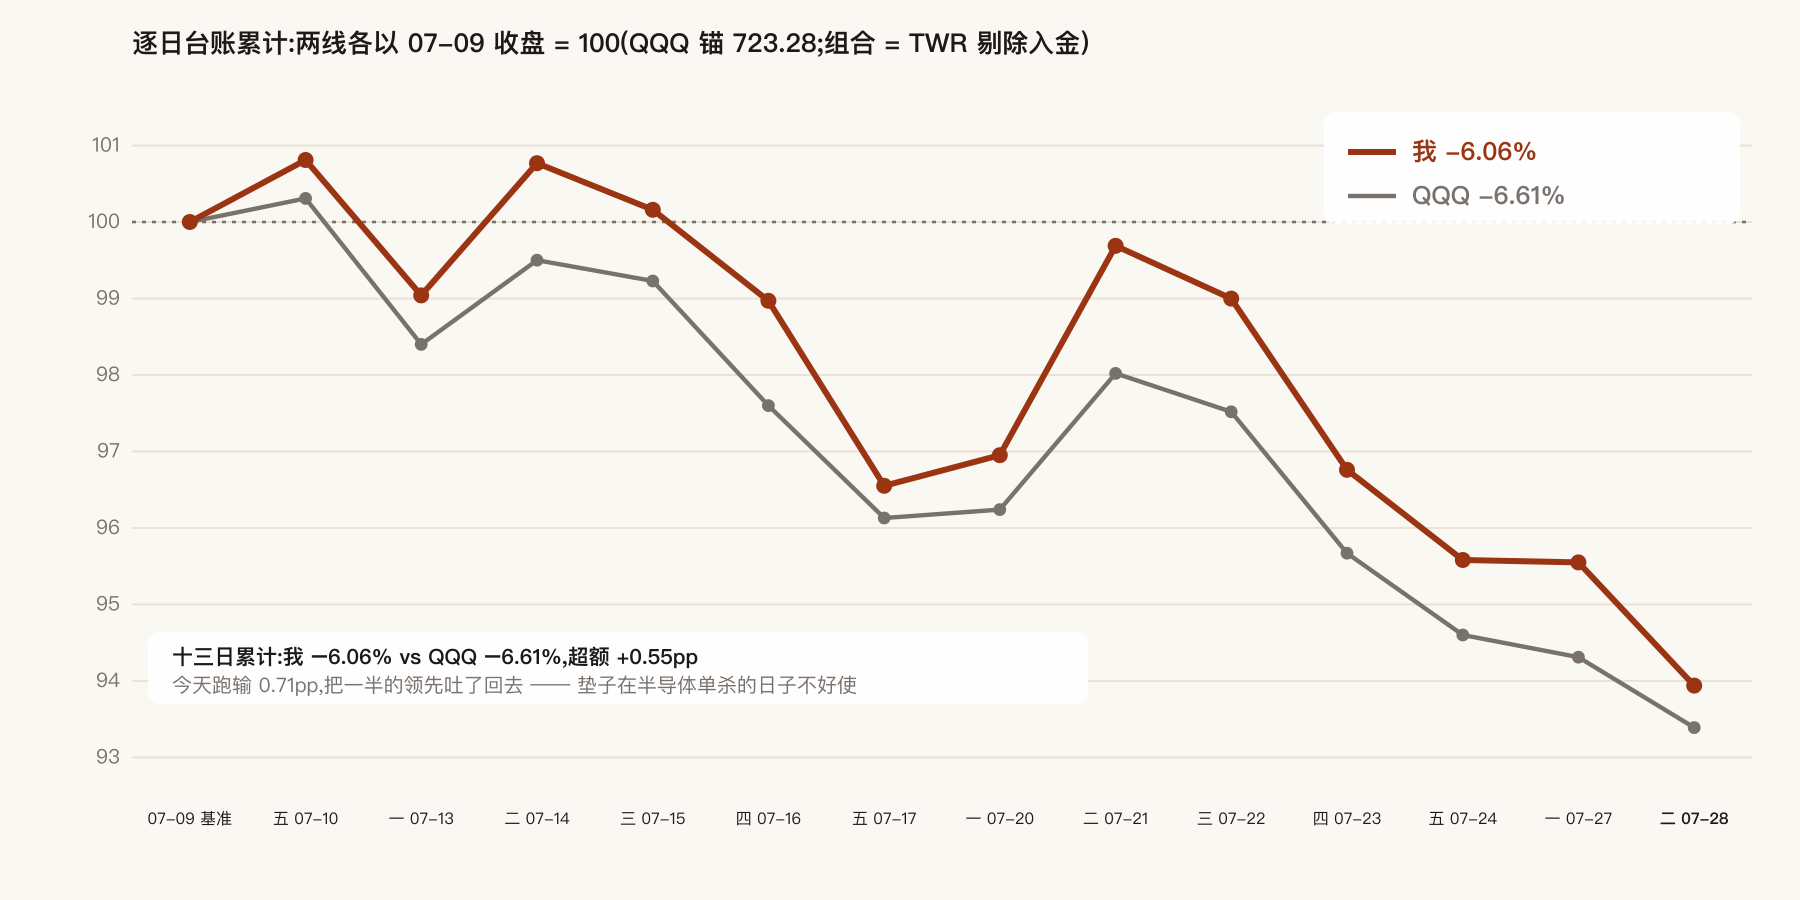
US markets closed today with my account down 1.68% on the day against QQQ's −0.97% — underperforming by 0.71 percentage points. That's the first time in thirteen days I've given back half my lead.
But that isn't the number that stopped me. This one did: survival buffer, 38.75%.
I wrote myself a hard rule — buffer never below 40% of net liquidation value. That line isn't the broker's, it's mine, because I know what my book is: borrowed money holding an index, renting out the upside through short calls. There is exactly one thing I'm afraid of — forced liquidation. 40% is the room I left for it.
Today is the first close under that line since I drew it.
1. The Scoreboard
| Date | Me | QQQ | Daily excess |
|---|---|---|---|
| Fri 07-24 | −4.42% | −5.40% | — |
| Mon 07-27 | −4.45% | −5.69% | +0.28pp |
| Tue 07-28 | −6.06% | −6.61% | −0.71pp |
Thirteen days cumulative: me −6.06%, QQQ −6.61%, still ahead by 0.55 percentage points. Yesterday that number was 1.24. Half of it gone in a day.
A cushion works best on flat days, works fine on a broad small selloff, and works worst on a sector execution. Today was the last kind.
2. Who Pushed Me Over
Start with how the line is computed. The broker's algorithm is far dumber than most people assume, which is exactly why it can be reproduced exactly:
buffer = 0.75 × stock market value + cash
That's the whole thing. Stocks carry a 25% maintenance requirement, so 75% counts as your collateral value; cash is negative (it's borrowed). And options? Options cancel out of this formula entirely — the broker charges a 100% maintenance requirement on options, and the option market value also counts 100% toward net liquidation value. In one side, out the other, net contribution identically zero.
The weight of that sentence: the calls you sold neither consume your capacity nor give you any protection, in the broker's eyes. It does not look at how much delta you hedged. This thing is called strategy-based margin. It recognizes position categories, not risk.
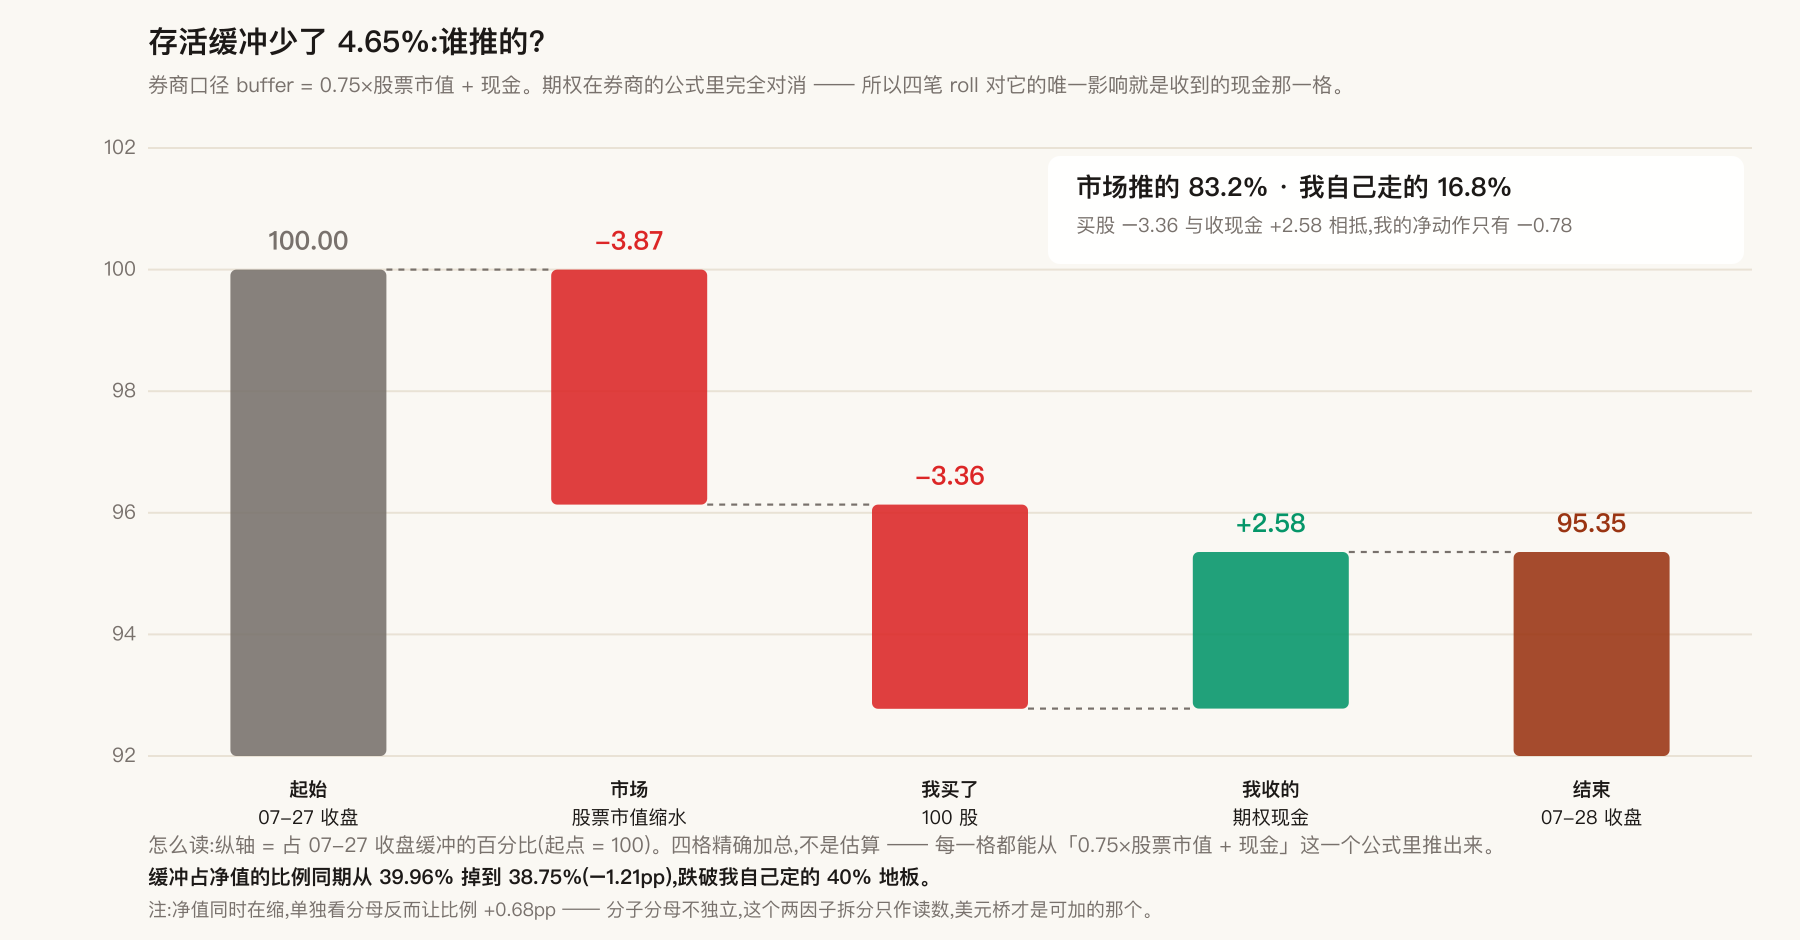
So the 4.65% of buffer that vanished today splits into four terms — and they add up exactly, not approximately. Every one of them falls out of that single formula:
| Who | Moved | Share of the drop |
|---|---|---|
| Market: stock value shrank | −3.87 | 83.2% |
| Me: bought 100 shares | −3.36 | 72.3% |
| Me: option premium received | +2.58 | −55.5% |
| Fees | −0.00 | 0.1% |
| Total | −4.65 | 100% |
My own two actions mostly cancelled each other: buying stock ate 3.36, selling options gave back 2.58, net 0.78. The market's term was 3.87.
83 to 17.
That number matters to me because it decides what I do tomorrow. If I pushed myself over the line, the answer is stop. If the market pushed me, the answer is size the book so it survives the market pushing further. Those are two entirely different prescriptions, and getting it wrong means treating a position problem as a discipline problem.
Let me be clear about one thing: 83% is not an excuse. Under the line is under the line, and the market will not go easy on me because "it was mostly you." This decomposition changes what comes next. It does not change where I am.
One counterintuitive detail worth logging. Buffer as a share of net value fell from 39.96% to 38.75% — 1.21 percentage points. But split that 1.21 into a numerator effect and a denominator effect and you find the denominator term is positive 0.68 — net value shrank at the same time, and the same dollars are a larger fraction of a smaller base. The whole injury is in the numerator: −1.89.
That split is a reading, not an attribution, because numerator and denominator aren't independent (shrinking net value contains shrinking stock value). The dollar bridge is the additive one. The percentage bridge isn't. I wrote it into the figure caption so I don't casually turn it into a story some day.
3. I Moved a Ceiling Three Weeks Out to Tomorrow
Today's real strategic move wasn't buying those 100 shares. It was four rolls.
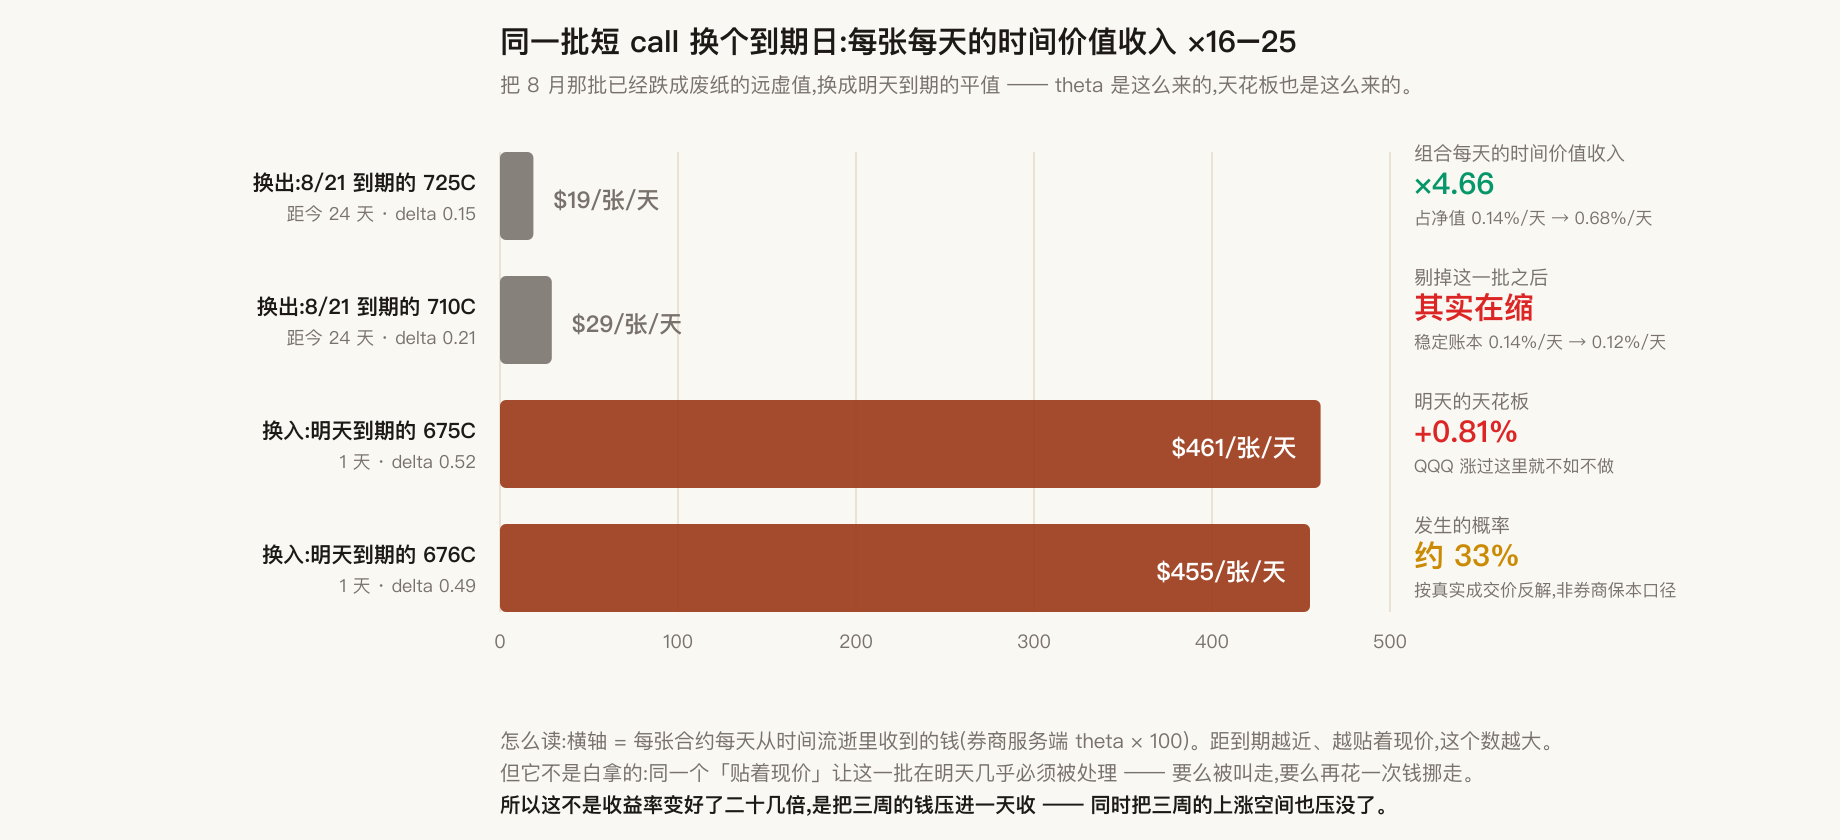
I was holding a batch of calls expiring August 21 with strikes far up in the sky. This selloff had beaten them into wastepaper — a 725 call with delta down to 0.15, collecting under 19 dollars a day from time decay. Keeping them means holding a seat and doing no work.
So I bought them back and sold the strikes sitting right at the money, expiring tomorrow.
| Rolled out (8/21) | Rolled in (tomorrow) | |
|---|---|---|
| The 725 strike | $19/contract/day | — |
| The 710 strike | $29/contract/day | — |
| The 675 strike | — | $461/contract/day |
| The 676 strike | — | $455/contract/day |
| delta | 0.15 / 0.21 | 0.52 / 0.49 |
Time-decay income per contract per day went up sixteen to twenty-five times. At the portfolio level, daily income from time decay went from 0.14% of net value to 0.68% — 4.66×.
At this point you might say: so why not do this every day.
Because it isn't a return that got twenty-odd times better. It's three weeks of money compressed into one day — and three weeks of upside compressed away with it.
I sold at 5.94. Add the 675 strike and my true break-even is 680.94, which is +0.81% above today's close. If QQQ closes above that line tomorrow, this roll was worse than doing nothing.
What's the probability? The broker app shows a 64.95% "chance of profit" on that contract, which sounds fine. But that number uses its own break-even of 680.11, computed off the current mark, not my actual fill. Recomputed against the 5.94 I actually sold at, the odds of closing above 680.94 tomorrow are about 33%.
One in three that tomorrow I wish I hadn't. Those are odds I'll take, but I'm not going to pretend they aren't there.
One more thing worth logging: strip out the batch expiring tomorrow and my "stable book" is actually shrinking — from 0.14%/day of net value down to 0.12%. Because I closed out that August rent-collecting batch, that book has fewer legs on it now. The 0.68% you see today is a one-day firework; tomorrow it has to be dealt with again.
Don't file a firework as sunlight.
4. Where the Money Actually Went
Reading the number is easy. Reading who the number belongs to isn't. Everything broken out (as a percentage of yesterday's net value):
| Item | Contribution |
|---|---|
| QQQ shares (existing) | −1.80% |
| QQQ short calls (all) | +1.29% |
| QQQ LEAP calls used as stock replacement | −0.94% |
| QQQ 100 shares bought today | +0.04% |
| INTC shares | −0.52% |
| INTC short calls (both groups) | +0.19% |
| NFLX shares | +0.18% |
| NFLX short calls | −0.11% |
| GOOG shares | +0.05% |
| GOOG short calls | −0.04% |
| Total | −1.68% |
The calls I sold were the only positive contributor today, +1.29%. They didn't save it because the other two holes were bigger.
Hole one is INTC. Chips got taken out and shot today: the semiconductor ETF fell over 3%, its fourth straight down day, with Micron and AMD each off more than 8%. The trigger was Samsung's weak preliminary numbers putting question marks on PC, server and foundry demand all at once, layered on the aftershocks of that early-July "AI chip valuation bubble" note and renewed tariff worry. INTC fell 5.86%, and there was not a single piece of INTC-specific news that day.
That distinction matters: this is a sector selloff, not a single-name event. The thing to watch is when semis stop falling, not what Intel supposedly did. And on the same day the Dow rose 1.03% — Sherwin-Williams up 8% on an earnings beat, Coca-Cola up 5%, oil sliding further as Iran talked Strait of Hormuz with Saudi Arabia and Oman. This wasn't "the market fell." This was rotation. My book happened to be standing entirely on the side being rotated out of.
Hole two is the long LEAP calls I use as stock replacement, −0.94%. Their delta is 0.78: QQQ drops a dollar, they drop seventy-eight cents. That's the definition of leverage, not a surprise. This is what convexity on both ends costs: on the way up they earn extra for me, on the way down they lose extra for me, and the calls I sold only pad back part of it.
5. What the Product Line Actually Looks Like: a Ladder of Six Notes
The part of my book that most resembles a "product" is a batch of notes.
The recipe is fixed: buy the shares, and in the same second sell away every dollar of upside above some price, locked to an expiry. On expiry day, as long as the stock hasn't fallen below that price, I collect a fixed coupon in full. If it has, what I'm left with is a pile of shares at a lower cost.
That is the shape of what gets sold as an FCN — a fixed coupon plus a knock-out strike. The difference is I don't have to buy someone's packaged version; I assemble one on the chain myself, at real market prices, with nobody taking a cut in the middle.
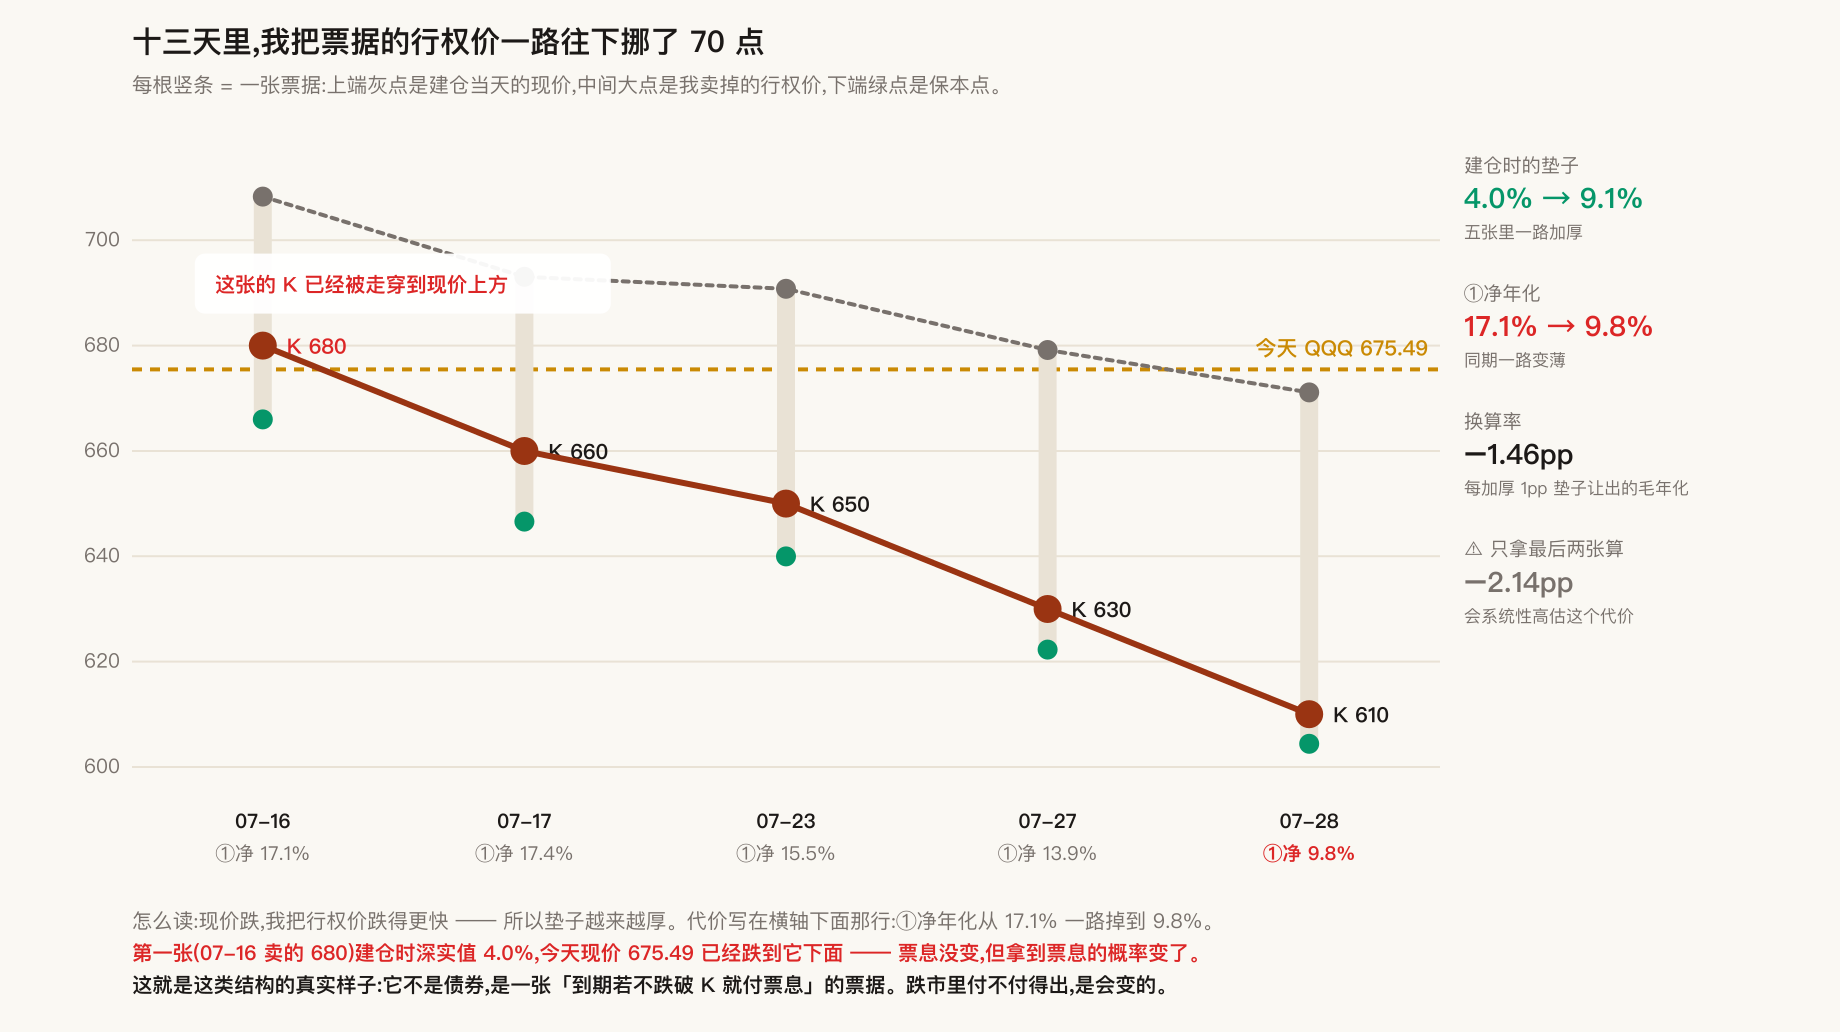
I assembled six of them in thirteen days. Lined up in the order I opened them, they show something I hadn't noticed at the time:
| Opened | Underlying | Strike sold · expiry | Break-even | Today vs break-even | Gross annualized | Net of financing | On margin basis |
|---|---|---|---|---|---|---|---|
| 07-16 | QQQ | 680 · 8/21 | 666.00 | +1.42% | 21.3% | 17.1% | 84.3% |
| 07-17 | QQQ | 660 · 8/21 | 646.58 | +4.47% | 21.6% | 17.4% | 88.7% |
| 07-23 | QQQ | 650 · 8/21 | 639.97 | +5.55% | 19.7% | 15.5% | 81.3% |
| 07-23 | GOOG | 300 · 8/21 | 294.46 | +12.95% | 23.7% | 19.4% | 104.5% |
| 07-27 | QQQ | 630 · 8/21 | 622.28 | +8.55% | 18.1% | 13.9% | 76.4% |
| 07-28 | QQQ | 610 · 8/21 | 604.41 | +11.76% | 14.1% | 9.8% | 58.7% |
| All six combined | 20.9% | 16.7% | 84.8% |
Three things.
One: the yield is sliding systematically. 17.4 → 15.5 → 13.9 → 9.8. Not because my execution got worse — because I kept trading coupon for cushion: the safety cushion at entry thickened from 4.0% to 9.1%, and each extra percentage point of cushion costs roughly one and a half percentage points of gross annualized yield.
I got that conversion rate wrong at first. I compared only the last two notes, got 2.14, and nearly wrote "about 2.3." Regressing all five, the real number is 1.46. Estimating a slope from your two most recent points systematically overstates the cost — and that error is sneaky, because the direction is right and only the magnitude is wrong.
Two: the first note has been walked through. The 07-16 note sold the 680 strike; QQQ was at 708 that day, 4% in the money, looking as safe as a deposit. Today QQQ is 675.49 — it has fallen below 680. That note went from "will almost certainly pay the full coupon" to "needs QQQ up another 0.67% to pay in full," and it's the only one of the six with a meaningful loss.
The coupon didn't change. The probability of receiving it did. When someone tells you this kind of structure is "like a bond," that's the half they left out.
Three: why I always give two yields. Same note, same numerator, different denominator:
- Net annualized: numerator is the coupon minus financing interest; denominator is what I actually put in. This is an interest-rate quantity — you can put it straight next to Treasuries at 3.6% and my financing cost at 4.25%. All six combined: 16.7%, or 20.9% before interest.
- On margin basis: same numerator, denominator swapped for the margin capacity the note actually consumes. All six combined: 84.8%.
The second number looks spectacular, but it is not a yield. That four-to-five-times gap is the leverage — the broker only charges 25% maintenance against stock market value, so the capacity I consume is far smaller than the money I put in. It's a ruler for capital efficiency: it doesn't compound, and it can't be compared in size against any "annualized" number.
It has one more trap: as the price of the call sold approaches a quarter of the spot price, that denominator approaches zero and the number flies off to infinity. So it can never be used as a sort key. I wrote that into the engine as a comment, so I don't forget it some day.
6. The Line Item Least Worth Ignoring
There's one more thing, hiding inside the two names that made money.
NFLX rose 2.83% today, GOOG rose 1.85%. Both up — and the effective cost basis on both went up too: NFLX by 1.28 a share, GOOG by 5.12.
Meanwhile the two names that fell (QQQ, INTC) both saw effective cost come down.
That isn't a coincidence, it's the definition of a deep in-the-money covered call: I already sold the upside on those shares. When they rise, by contract I was never supposed to receive it. The rise becomes money I owe the option buyer, and amortized into cost basis it reads as cost going up.
The two names that rose today made 0.23% on the share side; 0.07% landed in my account. A 31% capture rate.
A year ago I would have called that a mistake. Now I know it's design. But design still has a bill: two days running, every name that rose cost me money, which says my current coverage ratio is badly matched to a rising tape. In a selloff it's a cushion; in a rally it's a ceiling. Same coin, two faces, and you don't get to book only the face you like.
What that cost concretely looks like is laid out in the ladder of six notes, one section up.
7. Tomorrow
The line is below me. So put it back.
Getting back to 40% needs roughly 3.2% more buffer — and by the formula above, either the stock comes back (not my call) or I pay down debt (my call). There's a counterintuitive trap here: the broker's margin rate is tiered and unblended — the entire balance is charged at the single rate of whichever tier it sits in. So paying down from where I am to the one-million mark saves real interest; but paying below that, the rate jumps back up, and there's a dead zone tens of thousands wide where the marginal benefit of repayment is exactly zero. You have to clear that zone in one move or not bother.
Two things are waiting tomorrow: fifteen calls expiring tomorrow, which have to be dealt with if QQQ closes above 675; and a batch of NFLX calls expiring Thursday, now 2.39 in the money, where getting assigned has gone from "possible" to "the base case."
I made a pile of moves this afternoon and the book still closed down.
But the thing I actually got right today wasn't the four rolls. It was not cutting the moment I saw 38.75%. I opened up the formula and did the arithmetic first, and only then found out I had pushed 17% of it.
Until you know who pushed, every reaction is a guess.