WRITING
The Index Rose Just 0.11%, I Rose 0.41%: The First Day the Cushion Did the Earning, and a Covered Call Whose Ceiling Is Negative

July 20, 2026, Monday. The first session after Friday's monthly expiry. The index closed at 696.06, up 0.11% — the first nearly flat green candle in seven trading days.
Friday's post ended with: Monday, 3,100 index shares, 49 short index calls, and 1,100 freshly delivered shares, all on the field.
Today each of them turned in a report, and one of them surprised me.
1. For the first time, the cushion out-earned the stock
The result first: net value +0.41%, index +0.11%, ahead by 0.30 points.
Where that 0.30 came from is today's real story.
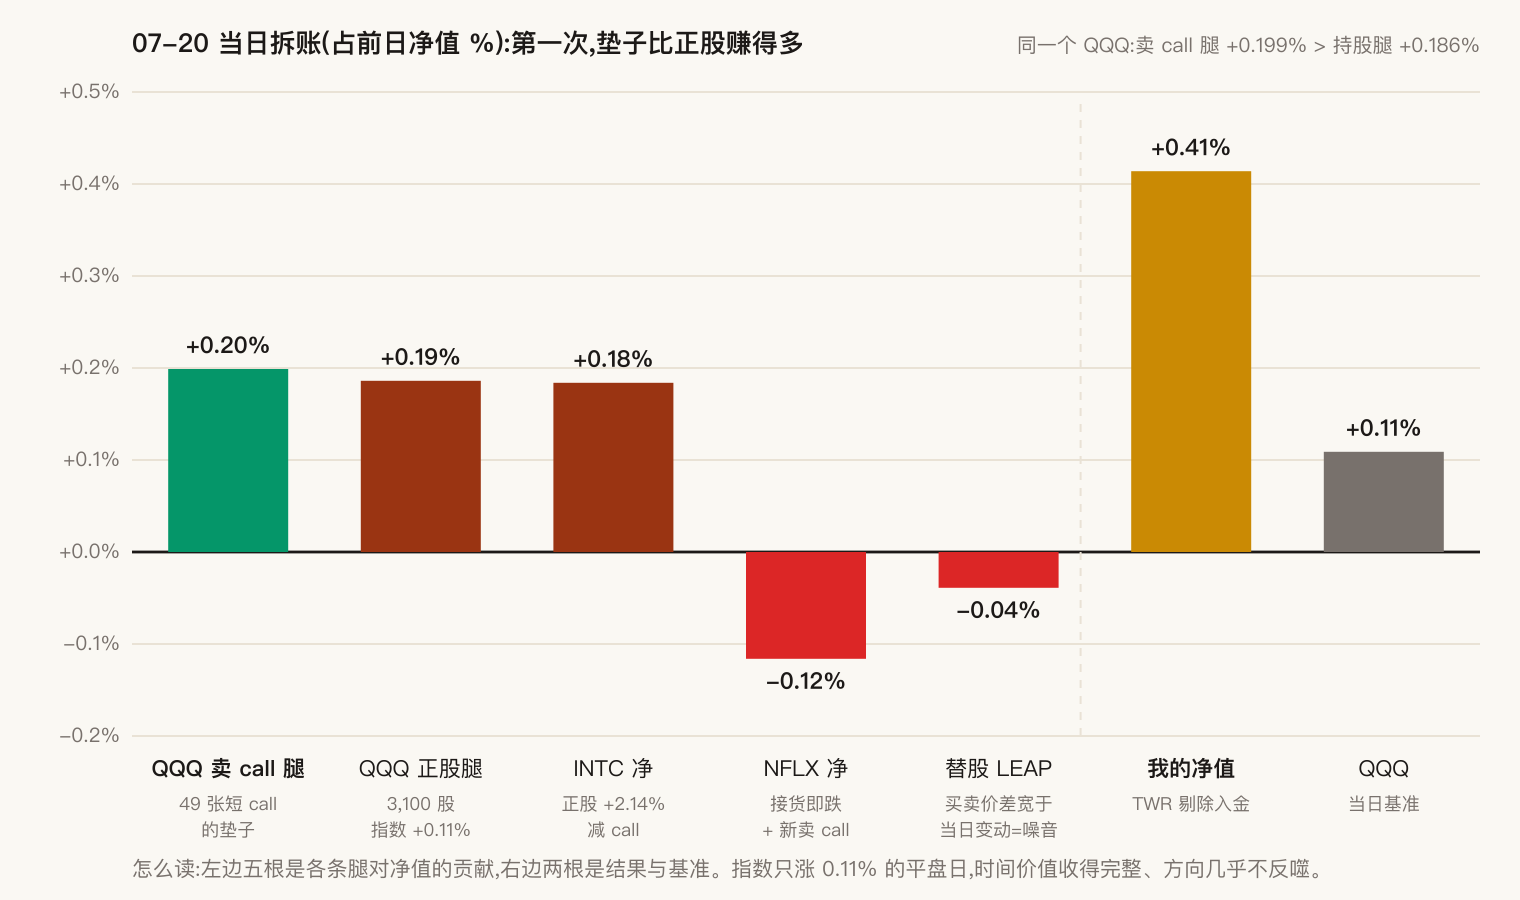
Over the previous six sessions the cushion was never the engine: on the down days it could only reduce the damage, never covering the hole the stock dug; on the up days the stock did the earning and the cushion was overshadowed. Friday was the extreme — the long side, shares plus the LEAP stock-substitutes (deep in-the-money long calls held in place of stock), lost 3.46%; the assigned put dragged another 0.49%; the cushion caught only 1.51%; net −2.44%.
Today flipped, and the reason isn't mysterious. It can be written as one equation.
2. The arithmetic of "time value," written out
People say selling options is "getting paid for time" and then stop there. How much it pays, and when it stops paying, can be stated precisely.
At Friday's close, the broker's figures put the combined time decay on my 49 short calls at 0.125% of net value per calendar day. Friday's close to Monday's close is three calendar days, so the time-value income for that stretch is:
0.125% × 3 = +0.375%
But those 49 short calls are short: when the index rises, they lose. Their combined directional exposure is equivalent to being short 2,359 shares of the index — 2,359 is simply each call's delta times 100 shares, summed across the 49 contracts (taken from Monday's closing snapshot; Friday's close differs by only 5 shares). At the current index price, those 2,359 shares carry a notional value of about 1.3 times my net value — which is why every 1% the index rises costs this leg 1.297% of net value.
Put the two together and you have the leg's complete P&L for those three days:
short-call leg (% of net value) = +0.375 − 1.297 × index move (%)
The coefficient 1.297 is unitless: for every percentage point the index rises, this leg loses 1.297 percentage points of net value.
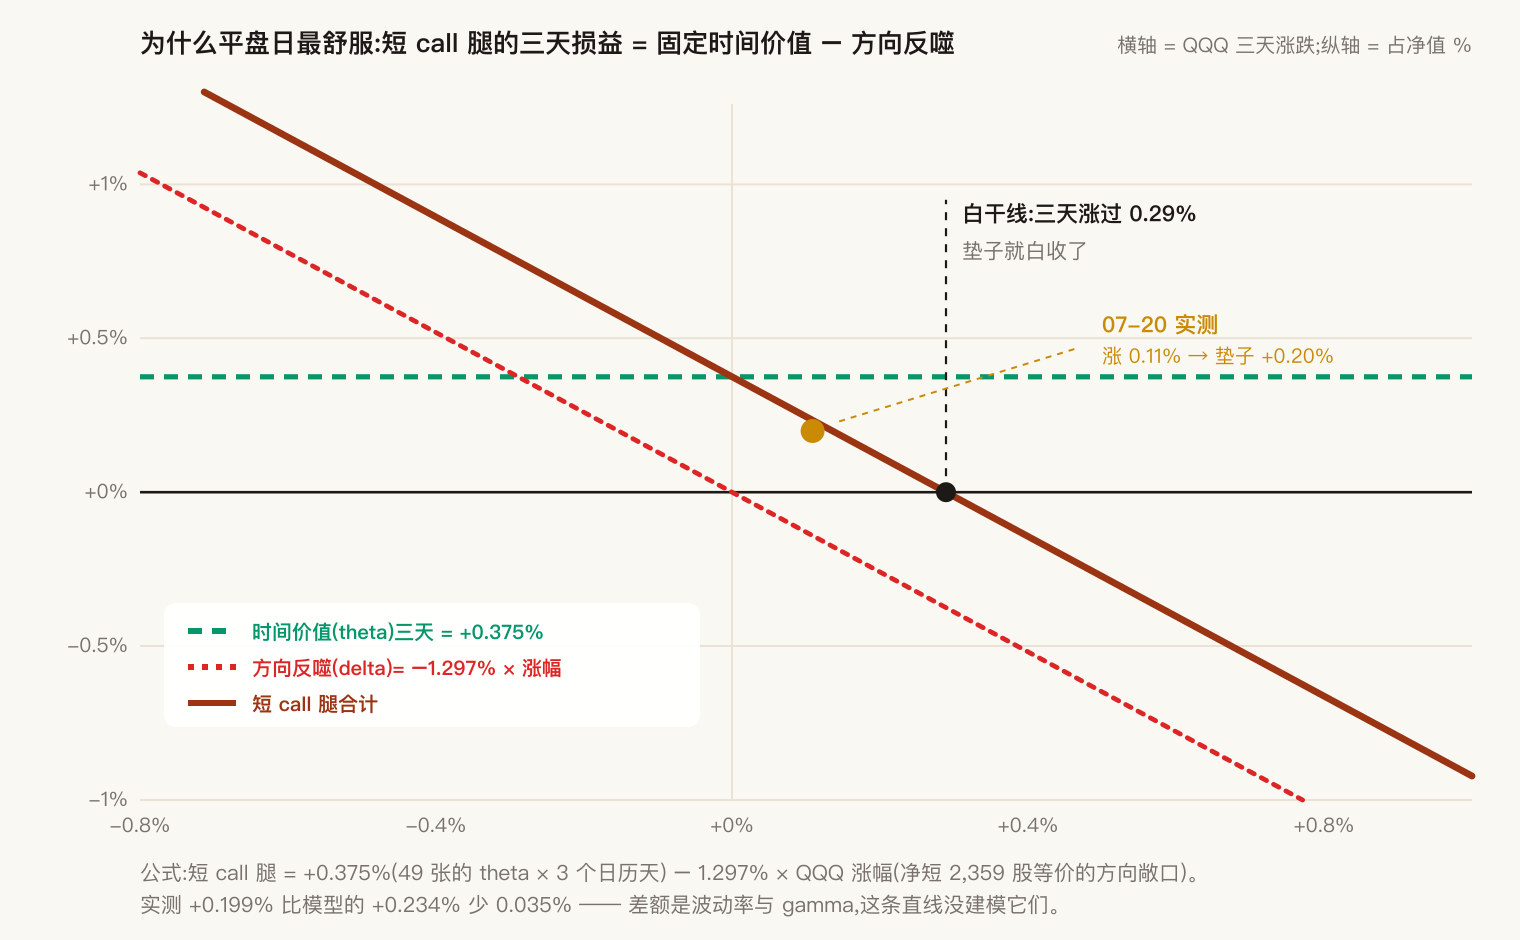
Solve it: 0.375 ÷ 1.297 = 0.289%.
In other words — at a 0.29% three-day rally, the time value is exactly eaten by the directional loss: collected for nothing. Past that line, the whole leg turns net negative — the direction costs more than the time pays.
Today the index rose 0.109%, less than 40% of the way to that line. Substitute it in: 0.375 − 1.297 × 0.109 = +0.234%. Measured, +0.199% — 0.035% short. The gap is volatility and gamma; this straight line doesn't model them. I write the residual down because models like this always have one, and a chart that hides its residual isn't worth trusting.
That equation also answers a question I get often: why do option sellers like a flat tape? In this equation, a flat tape sends the right-hand term to zero while the left-hand term still pays. A day the index doesn't move is the only kind of day this leg banks its time value in full.
And it marks the ceiling of the whole approach: this leg is structurally incapable of making money in a big rally. Still within the same three-day window: up 1%, it loses a net 0.92%; up 2%, it loses 2.2% — the theta term scales with the window, the slope of the directional bite doesn't. I run it to smooth drawdowns and collect rent — never to make money.
3. A covered call whose ceiling is a negative number
I filled exactly one order all day, and it needs an audit.
The 1,100 shares I was assigned on Friday settled over the weekend at a broker cost basis of 73.13 (counting the full rent from that iron condor — a four-legged structure that sells a spread on each side — the all-in effective cost is 72.20). At 09:48 this morning I wrote 11 covered calls, strike 70, expiring July 31, collecting 0.89 per share.
Here's the problem: strike 70 is below my 73.13 cost.
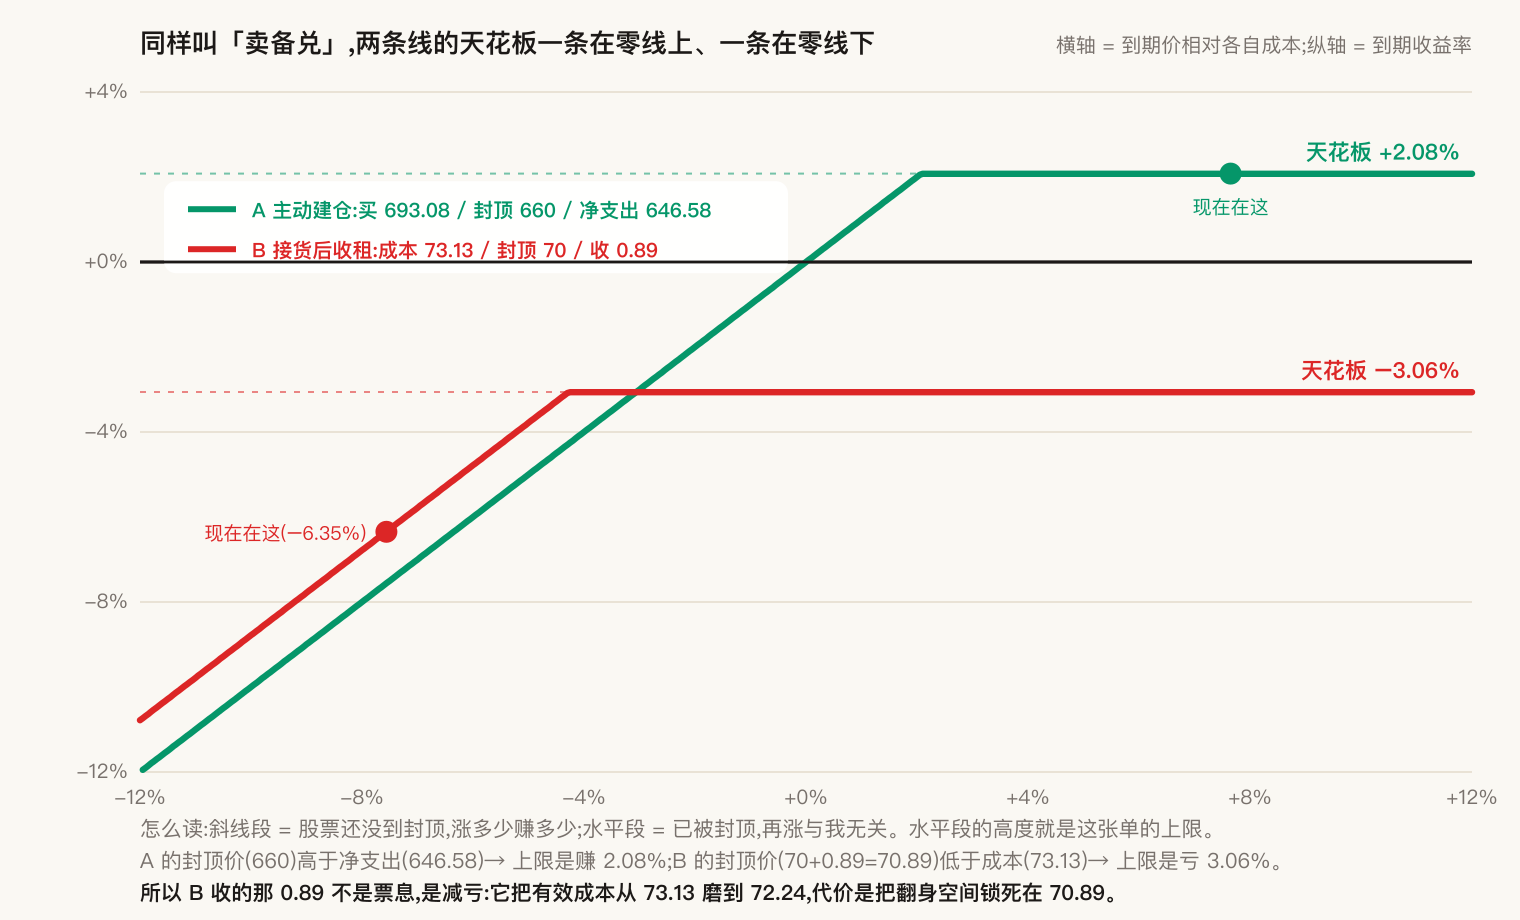
Throughout this series I keep saying that every structured trade has three numbers written down before the order goes out: where I buy, where I'm capped, where I start losing. Friday's were 693.08 / 660 / 646.58 — the cap (660) sits above the net outlay (646.58), so its ceiling is a 2.08% gain.
Today's are 73.13 / 70 / — and the cap plus the premium is 70 + 0.89 = 70.89, below the 73.13 cost.
First, the anchor: the stock closed today at 67.60, so the 70 strike still sits 3.5% above the price — out of the money. The probabilities below come from the option market's own pricing, solved strictly from this call's implied volatility and its 11-day term. The full sentence behind this trade is:
- About 71% of the time, the stock closes below 70 on July 31, the calls expire worthless, that 0.89 is banked, and my effective cost grinds from 73.13 down to 72.24 (broker-basis terms; in the all-in terms above, from 72.20 down to 71.31);
- About 29% of the time, it clears 70 and the shares are called away at 70; add the 0.89 premium and the effective exit is 70.89 — a 3.06% loss against 73.13.
(One trap worth defusing along the way: the 77% my broker's app shows on this trade is not the probability of closing below 70 — it's the probability that this short call itself doesn't lose money, which keys off the breakeven at 70.89, not the strike at 70. Between 70 and 70.89, the shares get called away but the call leg still ekes out a gain.)
That 0.89 isn't a coupon, it's loss reduction. What it buys is a small certain drop in cost basis. What it sells is these 1,100 shares' room to recover over the next month — the upside is welded shut at 70.89.
The trade itself isn't wrong. It's exactly how I handled the last position I got stuck in: that chip name's broker basis now reads 108.95; the "ground down to 71" I cited two posts ago was the arithmetic before 2,100 of those shares were called away — with only 1,200 shares left, the full rent collected over the window spreads across those 1,200, and today's engine run puts the effective cost at −9.13. Negative. The two numbers can't be compared directly, but they say the same thing: the assembly line works.
But the accounting has to stay separate: a trade opened deliberately collects a positive coupon; rent collected after you're underwater is a negative one. They cannot be added into the same "rent collected this month" line. Mixed together, the yield table inflates — and it inflates in exactly the place I most need to be watching honestly. I've written that convention into my own position ledger.
4. Net value rose; every risk number got worse
Today was green, and three numbers moved the wrong way at the same time:
| Metric | 07-17 | 07-20 | Note |
|---|---|---|---|
| Gross leverage | 2.59x | 2.65x | Second straight day above my own 2.5x hard cap |
| Distance to a margin call | 34.7% | 32.2% | My own floor is 40%; now well below it |
| Financing cost | 3.7%/yr | 4.00%/yr | See below |
The third line is the sharp one. This book is a barbell: one end is "stock underneath, sell calls on top" — the safe leg, holding 91% of my capital; the other end is deep in-the-money LEAPs — 9% of capital, but it goes to zero if the index falls through the long strikes. The benchmark for the safe end is short-term Treasuries, currently around 3.6%.
My financing cost went to 4.00% today.
The rent that leg collects still nominally dwarfs the interest bill; what stings is the benchmark — its risk-free comparison (3.6%) is now below what I pay to borrow (4.00%). If that leg only ever earns the Treasury rate, the carry is negative; the rent it collects has to genuinely cash in the variance risk premium to justify the money borrowed underneath it. This is no longer a metric to watch casually — the stable end of the barbell has started yielding to the cost of its own financing.
And today I did nothing to reduce leverage — taking delivery added another $82,500 of debt. The automatic repayment channel for the main block, those 49 index short calls, isn't until August 21. In between there are only two small valves on July 31: the 2 chip-stock calls at the 90 strike are now deep in the money, but assignment would repay only about 1.5% of the debt; the freshly written 11 NFLX 70-calls have roughly a three-in-ten chance of being called away, worth about 6.5% — drops in the bucket against the whole debt.
5. Scoreboard
| Session | My portfolio | Index | Excess |
|---|---|---|---|
| Fri 07-10 | +0.81% | +0.31% | +0.50pp |
| Mon 07-13 | −1.76% | −1.90% | +0.15pp |
| Tue 07-14 | +1.74% | +1.12% | +0.63pp |
| Wed 07-15 | −0.60% | −0.27% | −0.33pp |
| Thu 07-16 | −1.19% | −1.64% | +0.46pp |
| Fri 07-17 | −2.44% | −1.51% | −0.93pp |
| Mon 07-20 | +0.41% | +0.11% | +0.30pp |
| 7-day cumulative | −3.05% | −3.76% | +0.71pp |
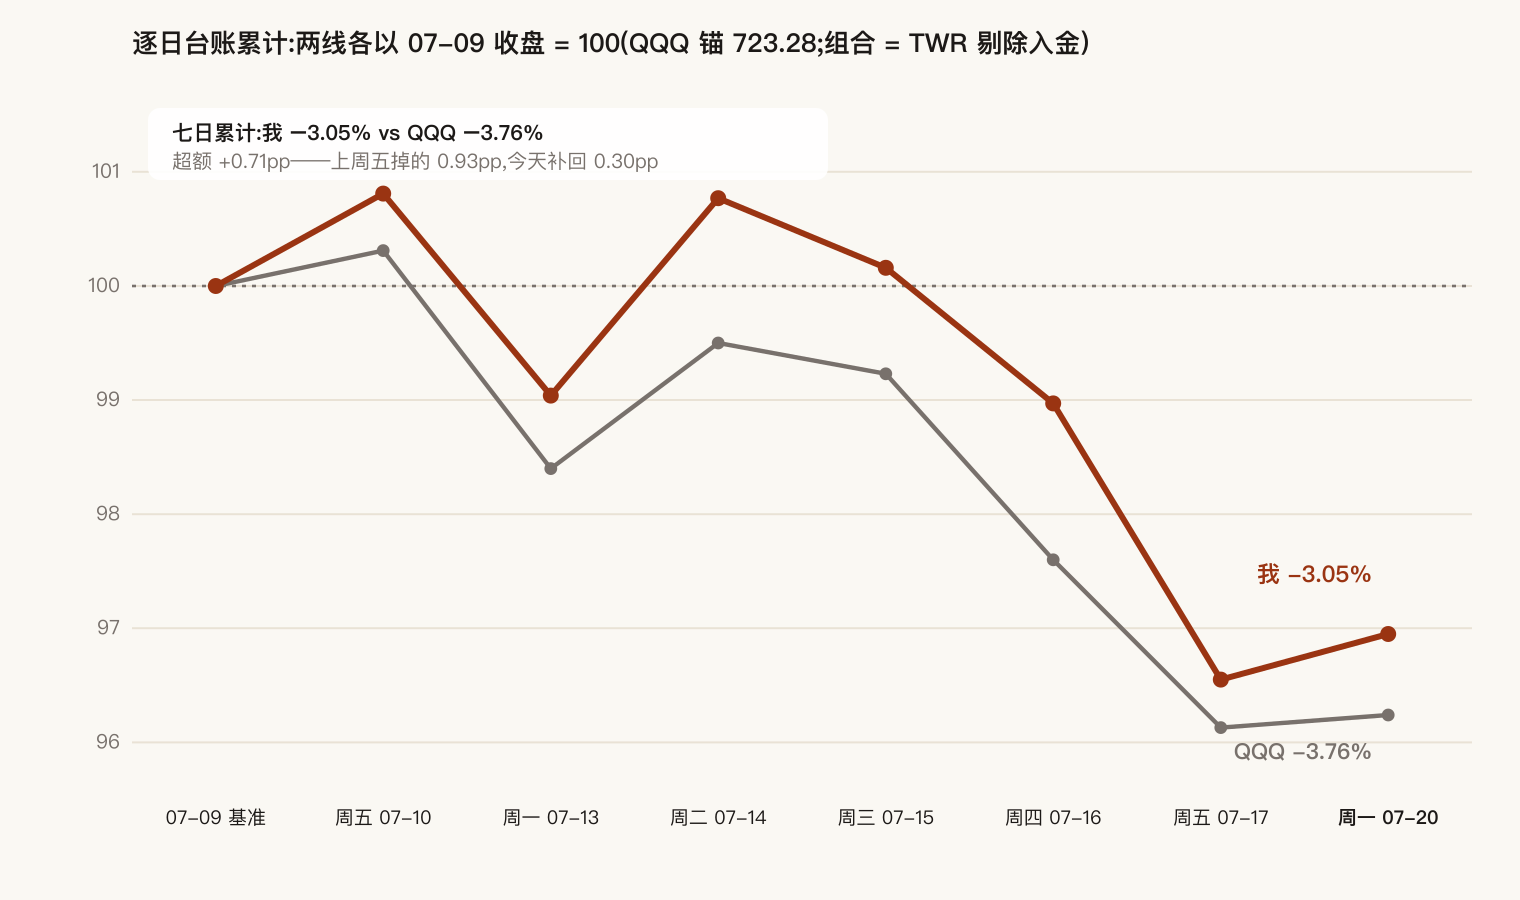
Conventions in full: the portfolio is TWR (deposits excluded), anchored to 07-09's close = 100; the excess column subtracts the two daily returns before rounding. Both lines are underwater; my 0.71-point lead only means "lost a little less." Friday cost 0.93 points of excess in one session — same convention as the table — and today clawed back 0.30 of them.
Close
Three things worth keeping on paper today:
The condition under which this strategy makes money finally got measured end to end. A line you can draw: it earns flat tapes and pays for rallies.
Two opposite trades hide under the same phrase "covered call." One has its ceiling above zero and is income. The other has its ceiling below zero and is loss reduction. Today I did the second one — correctly — but if I booked it as the first, I'd be lying to myself.
Risk can deteriorate on a green day. P&L and survivability are two separate ledgers, and today they moved in opposite directions — and only the second one decides whether I'm still here when compounding starts to matter.
The next large automatic repayment valve is August 21, with only the two small July 31 outlets in between. For that month, the 2.65x gross leverage and the 32.2% margin-call distance can only be managed by hand — whether to cut, and which leg to cut, is the exam the next post has to sit.