WRITING
CRITIC Objective Weighting: What It Rewards, and When It Quietly Breaks

Anyone who builds evaluation systems runs into the same question: who decides the weights? Expert scoring (AHP) gets accused of being arbitrary, so reports increasingly reach for CRITIC — the "objective" weighting method that supposedly lets the data speak. But most uses I've seen just run the formula: the weight table gets pasted in, and nobody can explain what the method rewards, what it punishes, or under which conditions it quietly stops working.
This post takes CRITIC apart: two intuitions, five computation steps, one complete worked example, and two failure modes almost nobody mentions.
1. What CRITIC rewards
CRITIC (Criteria Importance Through Intercriteria Correlation; Diakoulaki et al., 1995) assigns weights based on exactly two properties of the data:
Contrast intensity — an indicator on which every object scores the same cannot separate good from bad, and deserves no weight. Measured by the standard deviation : more variation, more discriminating power.
Conflict — an indicator highly correlated with the others is telling a story someone else already told; its information is redundant. Measured through correlation: the lower , the more unique information indicator carries.
Multiply the two to get the information content of indicator :
Weights are just normalized information content:
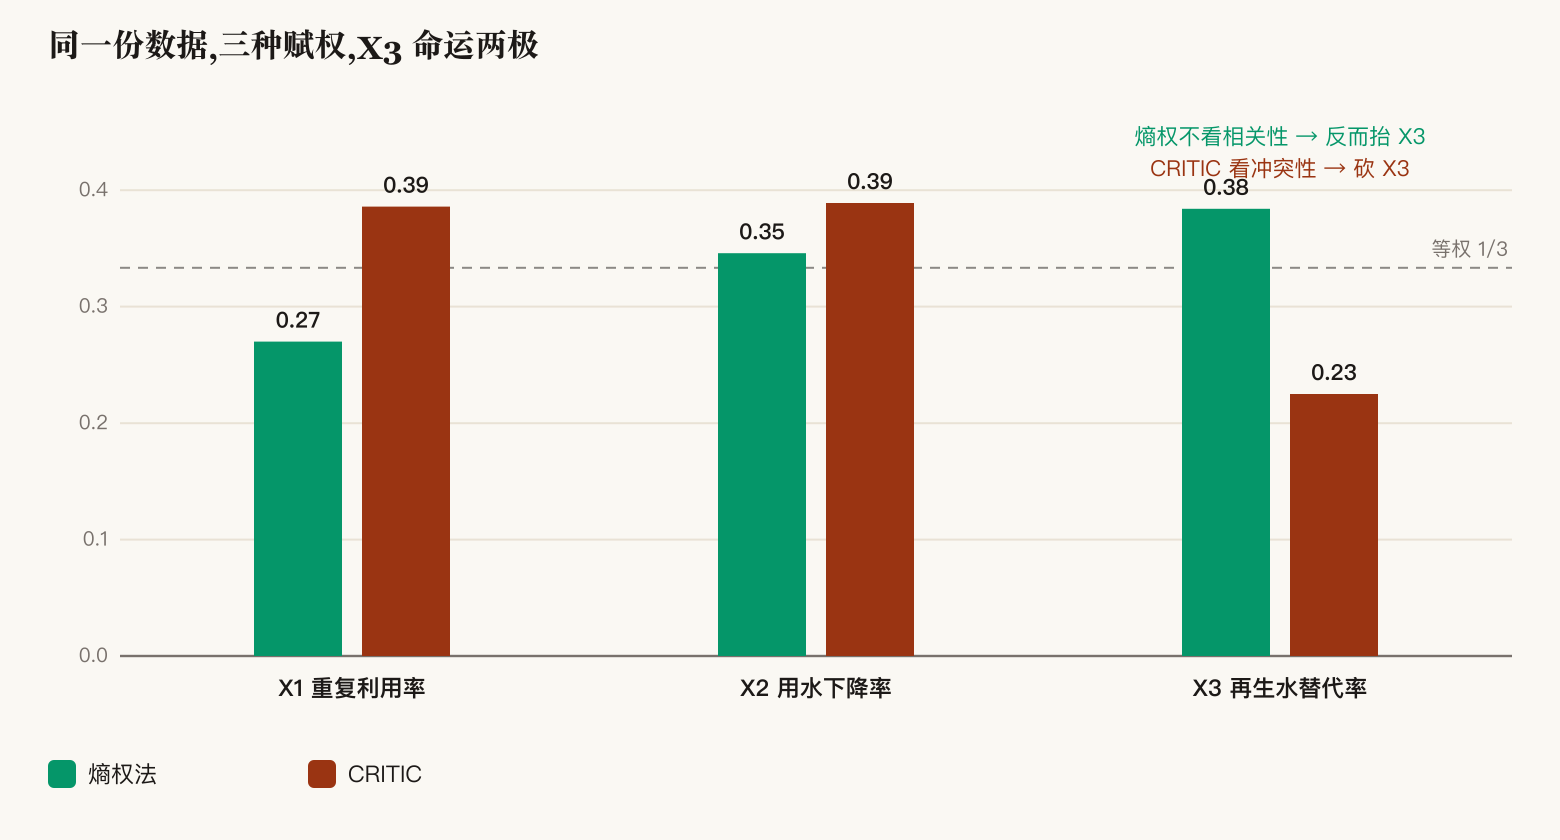
In one sentence: CRITIC gives weight to indicators that both spread the field and refuse to follow the crowd. That second half is what separates it from entropy weighting, which only looks at dispersion — and in the example below, the two methods hand the same indicator opposite fates.
2. The five steps
With objects and indicators, raw matrix :
Step 1 — normalize. For benefit indicators (bigger is better):
Cost indicators flip the numerator (). This one step handles both direction and units.
Step 2 — column standard deviations (sample std, in the denominator).
Step 3 — Pearson correlation matrix between indicators.
Step 4 — information content .
Step 5 — normalize into weights .
No iteration, no hyperparameters, twenty lines of code. The hard part isn't computing it — it's understanding what came out.
3. Worked example: three indicators, one gets cut
Take an industrial-park water-efficiency setting (synthetic teaching data, not real enterprises): 5 companies, 3 benefit indicators — X1 water reuse rate, X2 year-over-year reduction in water use per unit of value added, X3 reclaimed-water substitution rate.
| Firm | X1 (%) | X2 (%) | X3 (%) |
|---|---|---|---|
| A | 92 | 5 | 30 |
| B | 88 | −3 | 28 |
| C | 95 | 8 | 32 |
| D | 60 | 12 | 29 |
| E | 85 | 2 | 31 |
Run the five steps:
| X1 | X2 | X3 | |
|---|---|---|---|
| Contrast σ | 0.399 | 0.381 | 0.395 |
| Conflict Σ(1−ρ) | 2.09 | 2.20 | 1.23 |
| Information C | 0.833 | 0.839 | 0.485 |
| Weight w | 0.386 | 0.389 | 0.225 |
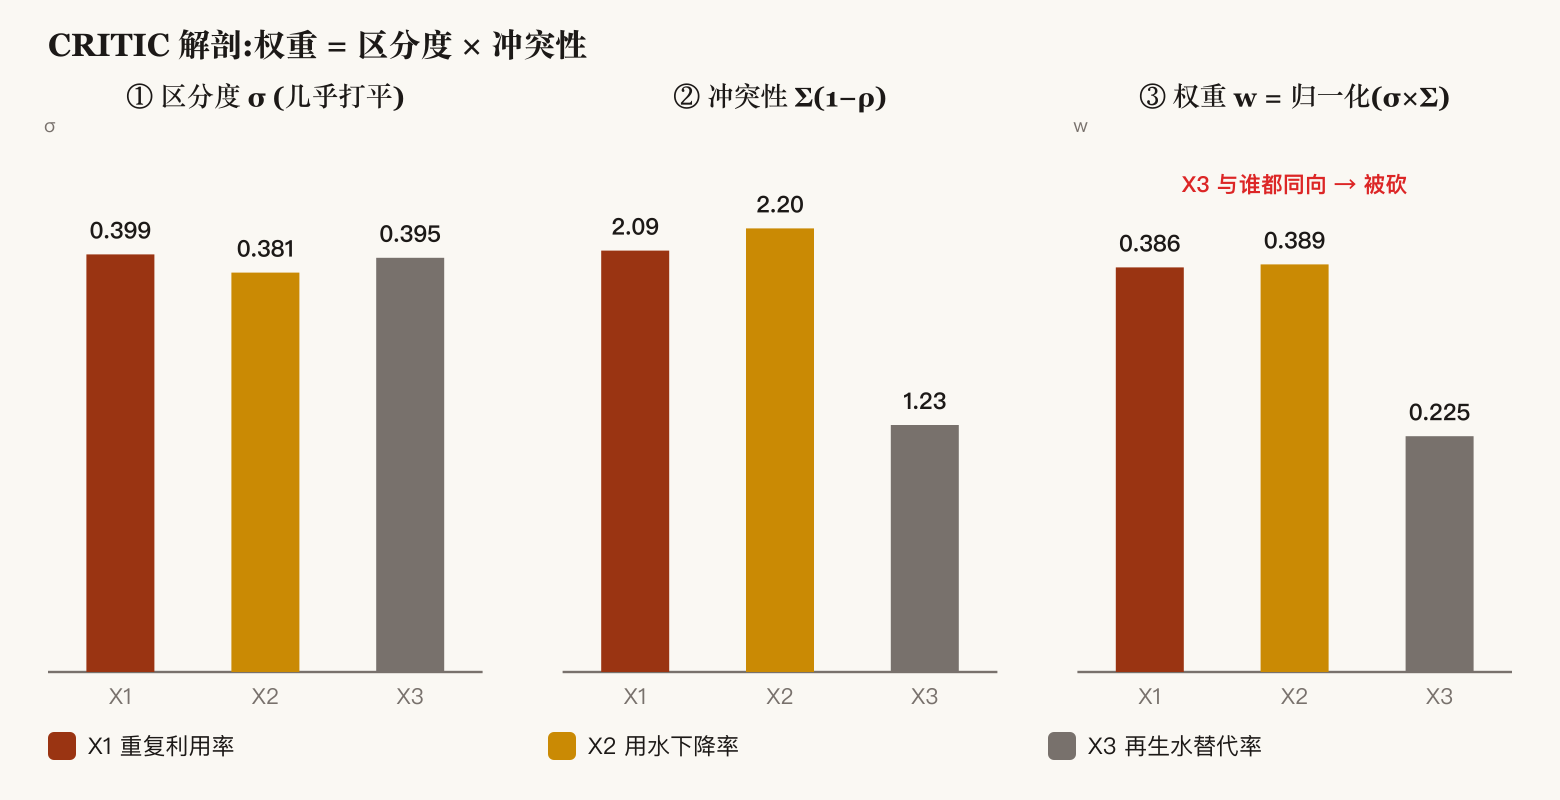
Two things worth noticing.
First, after min-max normalization, σ differences are usually small. Every column is squeezed into [0,1] with equal range; unless distribution shapes differ a lot, all standard deviations hover around 0.4. Many papers read CRITIC weight gaps as "this indicator varies more" — under the min-max convention, the correlation term is usually the one doing the work.
Second, why does X3 get cut? Look at the correlations: ρ(X3, X1) = 0.44, ρ(X3, X2) = 0.33 — it moves with everyone. Firms with high reuse rates also have high substitution rates; X3 adds no independent ranking information, so CRITIC calls it redundant.
Hand the same data to entropy weighting and the verdict flips: entropy looks only at dispersion, ignores correlation entirely, and gives X3 the highest weight of the three (0.384).
4. Failure mode #1: with only two indicators, CRITIC degenerates — exactly
I derived this on a real project. If an evaluation layer has only 2 indicators, write out the information content:
Since , the factor cancels in normalization:
The conflict information CRITIC is famous for contributes exactly zero. Whether the two indicators correlate at +0.99 or −0.99, the weights do not move:
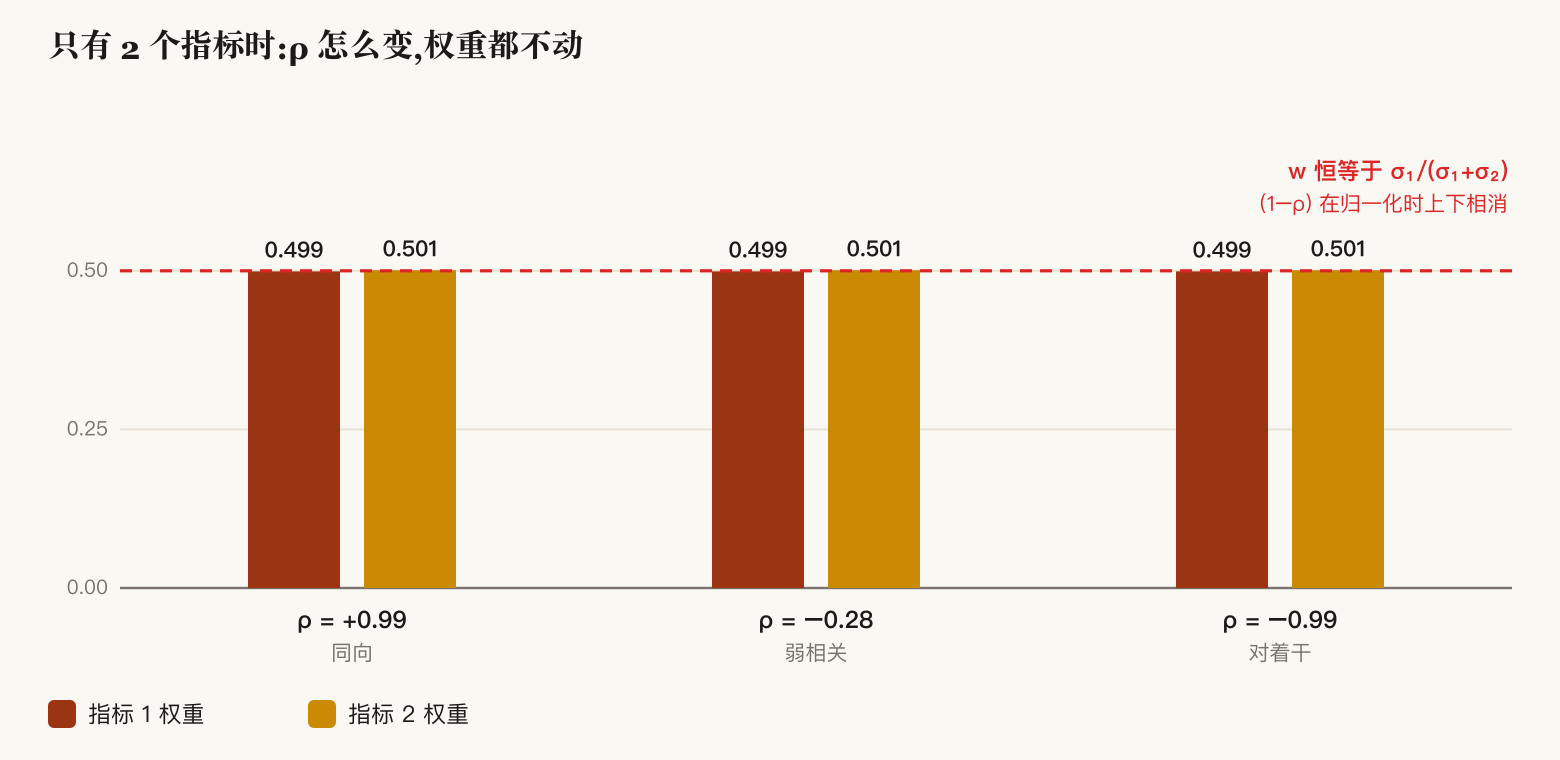
This isn't necessarily bad — "the more variable indicator gets more weight" is still defensible logic for a two-indicator layer. But writing "std-ratio weighting" in the report is more honest than writing "CRITIC combined weighting": the latter implies you used conflict information, and mathematically you didn't. If you want CRITIC to earn its name, start at three indicators.
5. Failure mode #2: where do the samples come from
CRITIC's input is a samples × indicators matrix; both σ and ρ are cross-sample statistics. Where the samples come from decides whether the weights are actually "objective."
Cross-sectional samples (the standard use): one year, many objects (5 firms, 20 parks). σ measures gaps between objects, ρ measures redundancy between indicators — clean semantics. Rule of thumb: at least 2–3× as many samples as indicators; 5 objects for 3 indicators is already the floor.
Time-series samples (the stretch use): one object (a district, a park), with years as samples. Three discounts to keep in mind:
- Too few years degenerates outright. With only 2 years, every min-max column becomes {0, 1}: equal standard deviations, correlation forced to ±1 — weights are either division-by-zero undefined or forced to a 50/50 split. That's not "imprecise"; it's zero information. Five years is merely the "runs without error" floor, and estimates stay noisy.
- Trend pollutes σ. In a policy's ramp-up years an indicator climbs monotonically (reclaimed-water use going from zero upward); σ is dominated by the trend and measures "how much it grew," not "how much information it carries."
- Rule values pollute everything. Conventions like "if the base period is zero, set the growth rate to 100%" inject artificial spikes; strip or winsorize them before CRITIC, or one 100% blows up σ.
So for a "single object, short series" layer: use honest subjective weighting or unweighted trend comparison, and write objective weighting into the methodology as a clause that activates once enough data accumulates. The method has to deserve the data — forcing a degenerate weight table is less respectable than admitting the data isn't there yet.
6. A field case: one three-tier system, both traps stepped on
The two traps above are not hypothetical. Consider a real three-tier water-efficiency evaluation system (an industrial cluster; structure below):
| Tier | Objects | Indicators | Samples × indicators |
|---|---|---|---|
| Macro (district) | the whole district, 1 | C1 reclaimed-water utilization rate, C2 design-capacity growth rate | 2 years × 2 |
| Meso (park) | one park, 1 | C3 pipe-network coverage, C4 reclaimed-water substitution rate | 2 years × 2 |
| Micro (enterprise) | 5 firms, same industry | C5 reuse-rate benchmark ratio, C6 water-intensity reduction rate | 5 firms × 2 |
The methodology chapter promises "AHP + CRITIC combined weighting for all three tiers." What actually happens:
The enterprise tier delivers. Five firms form a cross-section; σ and ρ have clean semantics; CRITIC runs year by year, feeding TOPSIS for ranking and grading. The pipeline is complete.
The district and park tiers don't — and can't. Each has exactly 1 evaluation object, so the only available sample axis is years, and there are only 2 of them — the extreme case of trap #2: after min-max every column is {0, 1}, the two σ are identical, ρ can only be ±1, and the weights are either division-by-zero or a forced 50/50. So the results chapter just lists indicator values as trends, and no weight table for C1–C4 exists anywhere in the document. Three tiers promised, one delivered.
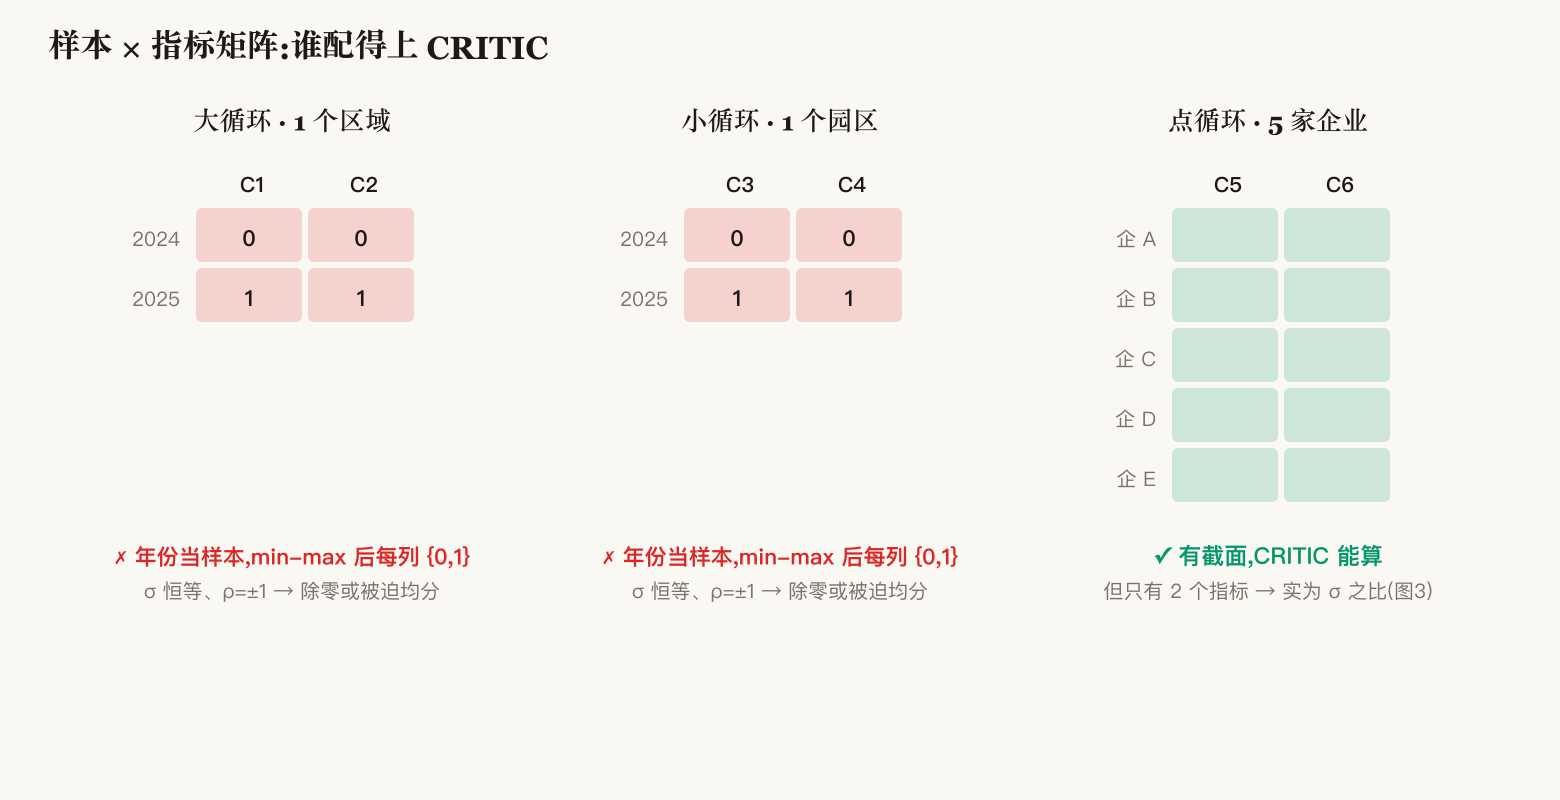
And here's the subtle part: the one tier that "can" run CRITIC doesn't escape either — it has only two indicators, C5 and C6. That's trap #1. On the surface it runs full CRITIC each year (combined weights 0.48/0.52, then 0.51/0.49); mathematically that is exactly the ratio of two standard deviations, with the conflict term contributing nothing.
One system, both traps, one each. The lesson is not "this system is wrong" — the three-tier decomposition is sound and the enterprise-tier TOPSIS ranking genuinely useful — but that the methodology's wording has to match what actually gets computed: state AHP (or unweighted trend comparison) honestly for the single-object tiers, write objective weighting in as a clause that activates once enough years or objects accumulate, and for the enterprise tier either expand to ≥3 indicators or call it std-ratio weighting.
7. When to use it, and how
My checklist:
- Use it: multi-object horizontal comparison (firm rankings, park benchmarking), ≥3 indicators, samples ≥ 2× indicators, genuine redundancy suspicion that data should adjudicate.
- Don't: single-object longitudinal evaluation; only 2 indicators (call it std-ratio weighting); samples contaminated with rule values or imputations.
- Don't use it alone: CRITIC speaks only for the data, and the data knows nothing about policy. In practice combine linearly with AHP — , with α = 0.5 as a common starting point: experts steer the direction, data handles the discrimination. Arguing over one α is far cheaper than arguing over an entire weight table.
One-sentence summary: CRITIC is not a stamp of objectivity. It just relocates the judgment "what counts as important" from an expert's head into the combination of three statistics — σ, ρ, and a normalization. Understand what those three are saying on your data, and only then does the weight table deserve a place in the report.