WRITING
Fix the Shape First, Then Bet the Direction

Nine major banks, and eight of them have year-end targets above spot. In a tape like that, the thing I trust least isn't the market — it's me.
Read research alone and you will only ever find the half of the evidence that supports the position you already hold. Look for someone to argue with and you can't find anyone willing to do the homework. So build a soundproof room: split the bull case and the bear case into two research tracks that can't hear each other, each digging up real institutional positions, neither knowing what the other is writing.
Three rules, locked:
- Total isolation — no shared intermediate output
- Every claim carries a source institution, a publication date, and a specific number. Can't find it? Write "not obtained." Fabrication is forbidden
- Each side must write a section titled "the opposing side's three strongest arguments, and why I think they fail" — no strawmen
Rule three is the load-bearing one. It forces a partisan to genuinely understand the opposition instead of picking a convenient punching bag. As you'll see, that section produced more information than the conclusions did.
Research can be outsourced. Judgment can't. I re-verified the load-bearing facts myself. I read both reports against each other line by line and compiled the contradictions into a list myself. And every number that had to land on my actual book, I recomputed against the live options chain myself — section seven is about that, because that's where I caught an error that would have cost real money.
1. The consensus first: nine banks, one bear
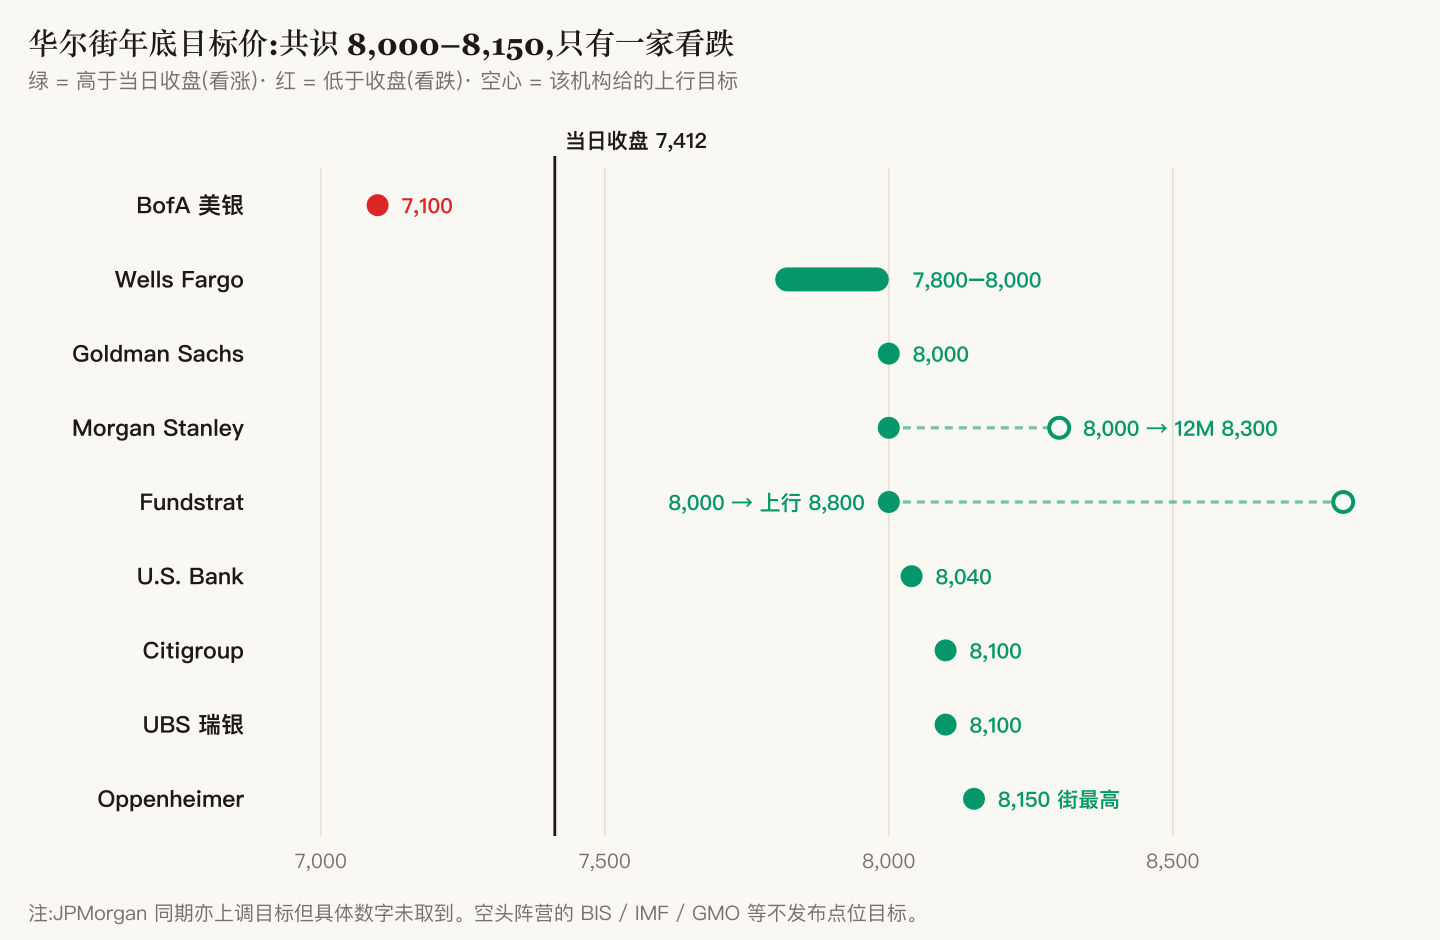
Of nine major banks, only Bank of America has a target below that day's close, implying roughly −4%. Every other target sits 5% to 10% above.
But the detail worth pulling out is this one: Fundstrat's target is at the high end of the field, and it simultaneously says a 10–20% drawdown comes first, at roughly 60% probability. Bullish target, bearish path. Morgan Stanley has the same shape — raising its target while warning that continued bond-market volatility would trigger the year's first meaningful correction.
Among professionals, "bullish" and "expects an imminent decline" have never been mutually exclusive. In retail discussion those two get collapsed into one thing constantly. That's the first gap.
2. The two nominally opposed sides overlap heavily
Lay the quantified positions side by side:
- The bull case: index higher over the next 12 months, 62% confidence
- The bear case: a drawdown of 15%+ within 6–12 months, 55% confidence
Both can be true at once. Down 15%, then finishing the year higher — and both are right.
I was waiting for a verdict on who won. What I got was something else: the region where they genuinely disagree is far smaller than it looks. Most of the firepower landed on things that aren't in conflict at all.
The two most telling.
Pseudo-conflict one: long-horizon valuation. The bear side hauls out the cyclically-adjusted P/E, the Buffett indicator, the equity risk premium — all three genuinely at historical extremes. But the bull side's own report states, in writing, "I do not claim that long-run annualized returns from this valuation can stay in double digits," and then supplies its own 1997 counterexample: after CAPE reached 31, the following five years returned 15% in total, about 3% a year. The bear won that round against an opponent who never showed up.
Pseudo-conflict two: market breadth. The bear side deleted this from its own evidence, voluntarily, because the data shows breadth improving rather than deteriorating — the equal-weight S&P hit an all-time high, and the number of constituents above their 200-day moving average was the year's highest.
Someone assigned to argue the bearish case, voluntarily removing a scary-sounding but unsupportable point. That single move did more for my trust in the rest of that report than any of its actual arguments.
3. The real split isn't bull versus bear — it's horizon
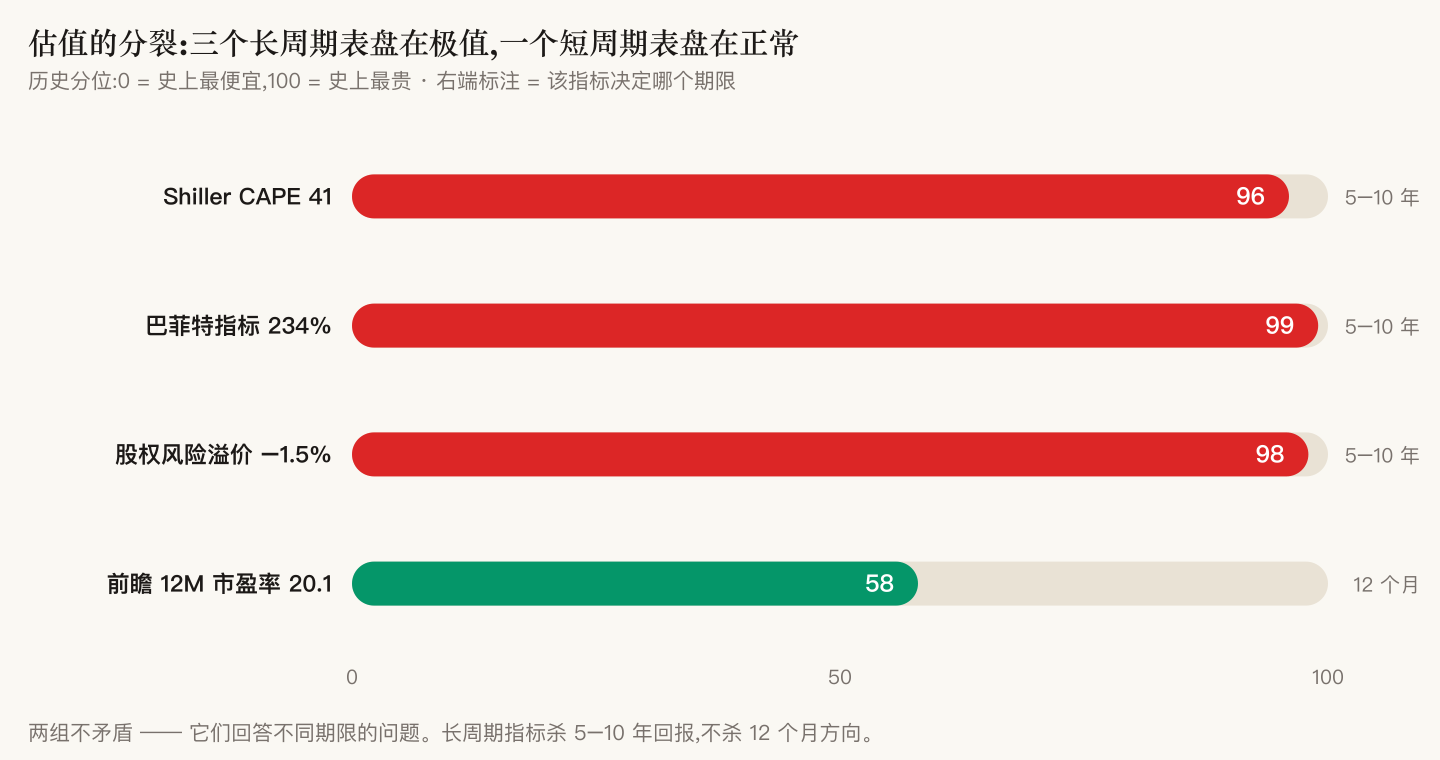
Three long-horizon gauges sit at the 96th–99th percentile, while the forward 12-month P/E — the measure whose horizon actually matches a 12-month holding period — sits at the 58th, barely above its five-year average and still falling, because earnings in the denominator are outrunning price in the numerator.
These two groups don't contradict each other. They answer questions about different horizons:
- CAPE uses ten-year smoothed earnings. It forecasts returns 5–10 years out — it kills the long run, not the direction
- Forward P/E uses the next twelve months of expected earnings. That's the one matched to "does it go up next year"
The same CAPE sat at a 60-year high continuously from 1995 through 2000 — one of the best stretches in market history. It sounded an identical alarm for 1996 and for 1999, and cannot tell those two years apart.
So when you see a frightening valuation number, the first move isn't panic — it's asking which horizon it governs. That's one of my biggest takeaways of the round, and it fell out of the "opposition's strongest arguments" section, not out of either side's conclusions.
4. Asia has already paid; US equities haven't
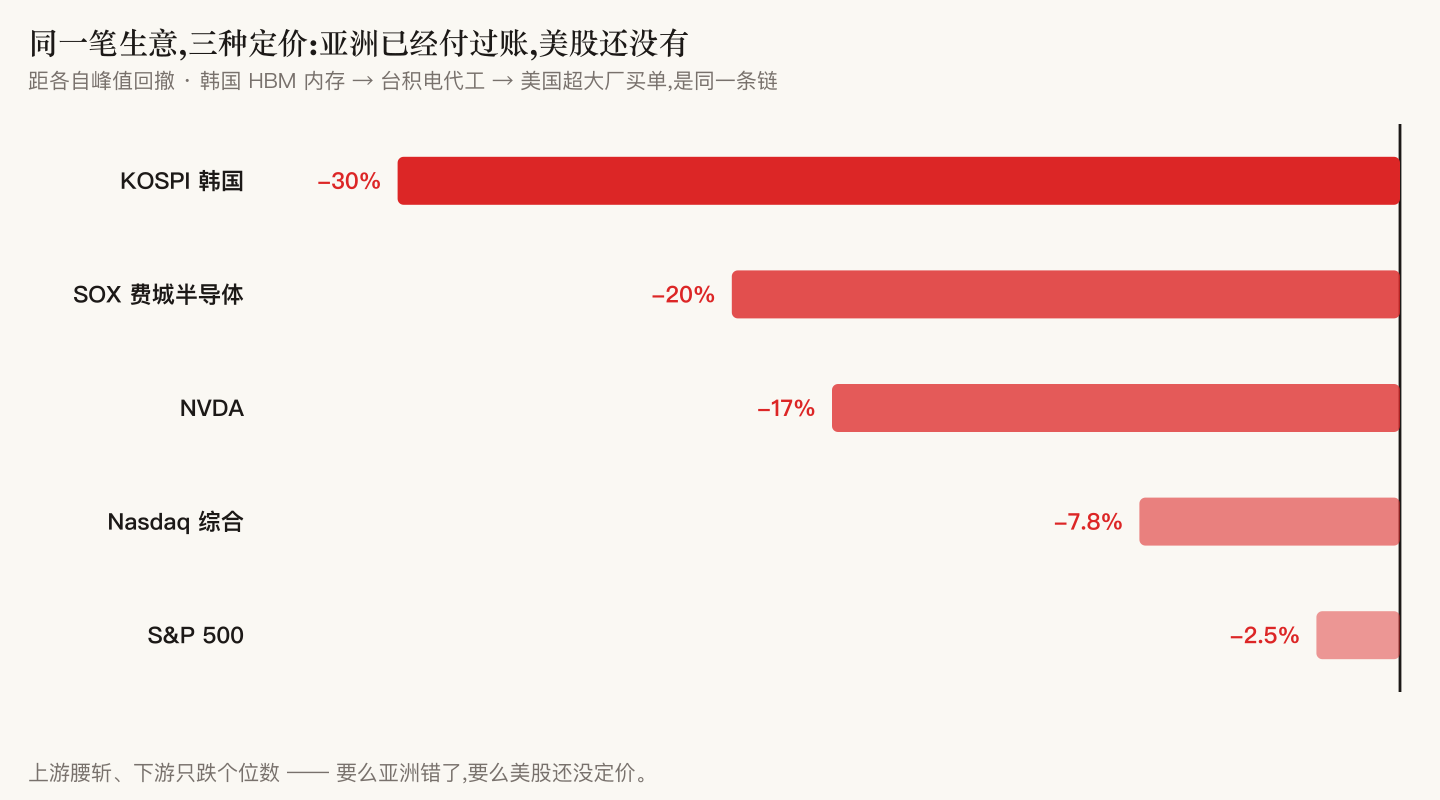
One supply chain, one week, three completely different prices.
The Korean end is the one to watch: the Korean composite fell roughly 30% from its June peak, with a 20% drop across 14 trading sessions — the steepest since 2008. Market-wide margin financing was wiped down 13.6% in two weeks. That's mechanical forced liquidation, not voluntary de-risking.
The bull side crashed here. Its Korean data stopped a week earlier, missing exactly the sessions in which the index broke, and it then used that stale data to accuse the other side of "reading it backwards, treating already-cleared inventory as live risk." The one treating cleared inventory as current was itself. Nobody handed me that ruling — I hit it while reading the two reports against each other, which is exactly why the conflict list can't be skipped.
But there's a reversal here, and the bear side listed it honestly against its own interest: Korea's forward P/E has fallen to 5.8x, below the 2008 crisis trough. And the character of this decline is leverage liquidation, while the earnings side is accelerating — Korean semiconductor exports that month ran near triple.
In the three historical cases where Asia led US equities down (2000, 2018, 2021), the transmission channel was earnings: Asian orders roll over, then US earnings follow. This time the financing side broke first.
If the character here is "the highest-beta, most fragile-financed end of a single trade getting squeezed out" rather than "a leading signal from the demand side," transmission to US equities may simply not happen. Still unproven — but it determines how fat the left tail is.
5. The cut I added myself
The bear side wrote its own downgrade rule into the report, in advance:
"If hyperscaler free cash flow turns negative and the Fed hikes, and credit spreads still don't budge → the market can absorb this capex cycle without a credit event, and I should voluntarily downgrade this entire thesis from 'expect declines' to 'expect lower returns.'"
It also admitted that the metric the rule depends on — the high-yield credit spread — was not obtained, "a serious gap."
So I went and looked it up. Result: the spread sits at the 16th percentile of its ten-year range. It hasn't budged. And the first half of the condition — one hyperscaler posting its first negative quarterly free cash flow in more than two decades as a public company — has already happened.
Its own downgrade condition is already half-triggered.
I'm making this permanent: anything that wants me to read it seriously has to state up front what would invalidate it. Anyone who can't write their own kill condition has never seriously considered being wrong. And it's also the cheapest way to read research — jump to the author's surrender condition, then check whether it has fired. Faster than reading the whole thing, and more accurate.
6. The calibrated distribution
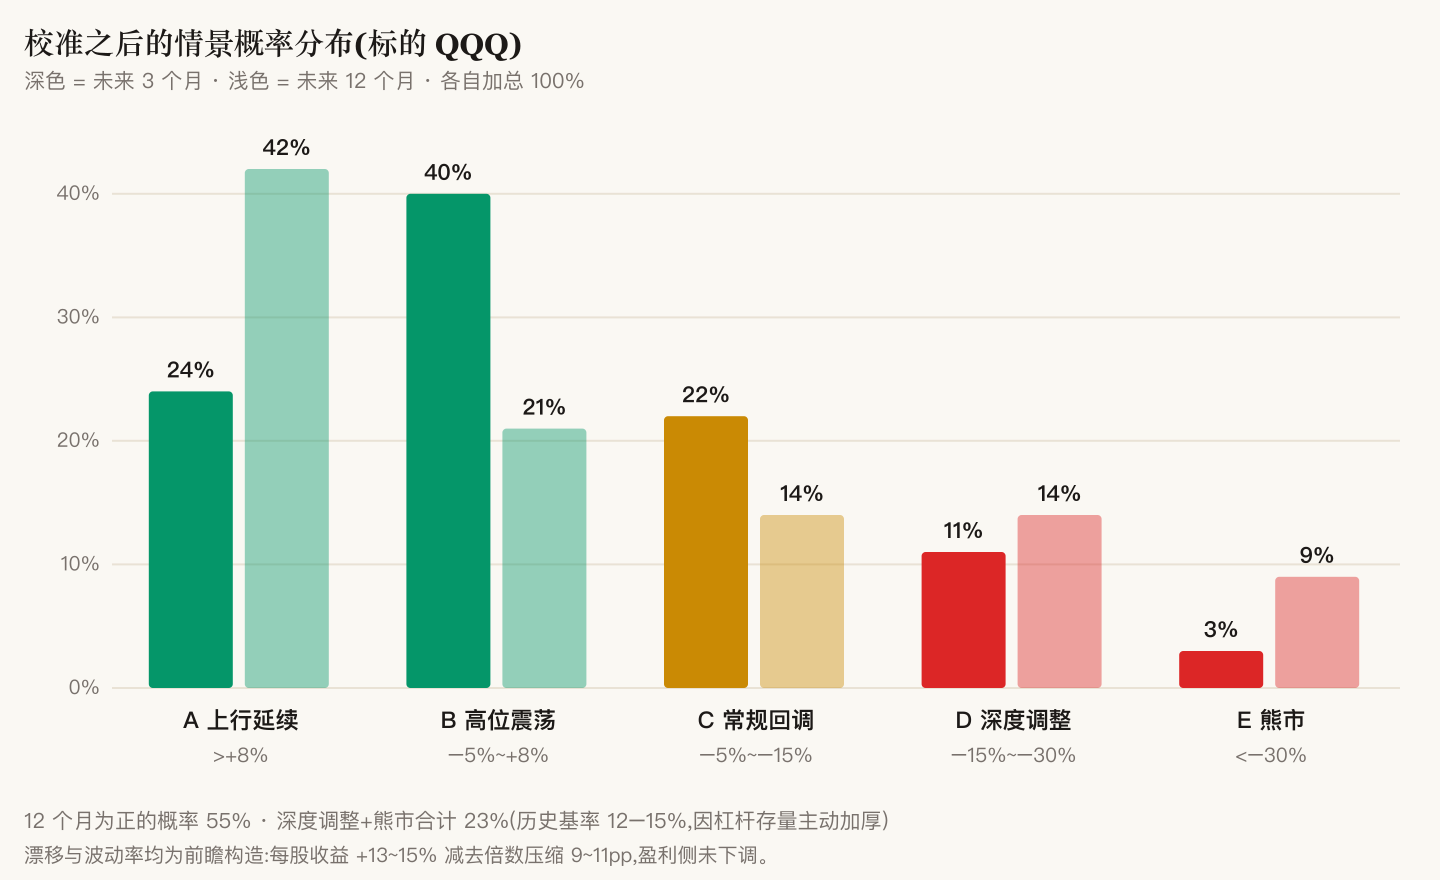
Probability of a positive 12 months: 55%. Deep correction plus bear market combined: 23%. The historical base rate is 12–15%; I deliberately fattened that bucket, on the grounds of record margin debt, institutional cash at unusually low levels, and the live real-world sample Korea is currently providing.
The drift construction has to be stated or that 55% is astrology: earnings growth of +13–15% (sell-side consensus, auditable), minus 9–11 percentage points of multiple compression (assuming one hike and no cuts after). Everything cut came out of the multiple; nothing was cut from earnings — because the earnings side held up on every number I could verify.
And that multiple compression is governed almost entirely by one variable: does the Fed hike once, or enter a sequence?
- One hike, and it's the last → 12-month expectation +0.6%
- A sequence → −9%
- No hike → +8%
One distinction neither side separated: the ~80% the market is pricing is the probability of one hike in September — not the probability of entering a hiking sequence. Those differ by an order of magnitude in consequence, and anyone who reads them as the same thing has the wrong conclusion.
7. The error that would have cost real money
The prescription came with a hedge structure and a cost estimate attached. I didn't copy it — I ran it against the live options chain:
- The estimated cost was 50% to 100% above the real quote on the chain
- The contract it picked had one-fifth the open interest of the strike next door — put that order in and it likely never fills
Switching to the neighboring strike, the improvement in geometric growth came out larger, not smaller. Same advice: one version stays on paper, the other can actually be worked.
That's the one operational takeaway I'd give anyone: digging up evidence and finding holes in the other side is work you can hand off. Pricing isn't. Any number you intend to act on goes back to the live chain first. That step took under ten minutes and saved either an order that never fills or one that costs twice what it should.
8. What finally ruled against me was the shape of my own book
Running the whole round, the finding that stung wasn't market direction. It was the shape of my book:
- Call coverage sits at exactly 100%, meaning upside participation starts collapsing at +2.3% and reaches zero by +6%
- And net exposure climbed from 0.99x to 1.56x across four consecutive down days — I did nothing; every day the market falls, my actual participation ratchets up on its own
I sold my entire right tail, and my left tail is adding to itself.
That's not a wrong directional call. It's a badly designed structure. Across roughly two-thirds of paths this book performs well; across roughly one-seventh it gives back years of profit. And volatility drag is supposed to be compensated by the right tail — I sold the source of the compensation and kept the drag.
So the real action item has nothing to do with bullish or bearish: fix the shape first, then bet the direction. Getting direction wrong costs you some upside. Getting shape wrong means that in exactly the stretch where you most need to participate, you have no right to.
9. What I'm keeping from the process
I assumed the value would be in the conclusions. Having run it, the value sits in three places in the process.
One: isolation is non-negotiable. Ask one person to write both sides and they converge to the middle, producing "both sides have a point, manage your risk" — which is nothing. Isolated, each side digs up angles the other never considered.
Two: the mandatory "opposition's strongest arguments" section is the highest-quality output in either report. The bull side conceded "the institutional cash level — I can't rebut this one." The bear side conceded "if Asia has already cleared, my second-strongest piece of evidence fails; this is my most fragile seam." These are self-authored weak points, and they're more accurate than any external critique.
Three: the conflict list has to be mine. Hand over two reports and you get back a bland synthesis. Hand over a table saying "these nine points contradict each other, rule on each," and you get actual rulings. And compiling that list can't be delegated — which vintage of a bank's target each side cited, which month's central bank policy rate, which two paragraphs of the same earnings release each side chose to quote. Only line-by-line reading surfaces that.
Final score: 4 to 4, but the nine points aren't equally weighted. The three that determine whether a thesis survives all went one way; the two that dismantle the other side's foundation all went the other.
And the most valuable output wasn't the score — it was the table of who used stale data, and where. One side's six errors were all the same error: citing an older version of the same institution's position. That isn't random noise, it's a systematic search bias — the easier something is to find, the older it tends to be. Knowing that, the next round writes the self-check straight into the rules.
Run one adversarial round and you get more than who was right this time. You get how to ask better next time.